How Heavy is the U.S. Debt Burden?
The last several months have seen a steady drumbeat of data to validate both declining inflation and a slowing economy. CPI inflation for June posted a significant milestone with its first negative monthly print since the depths of the pandemic in Q2 2020.
The remarkable deceleration of inflation in the last two years has allowed the Fed to shift focus within its dual mandate. With inflation on track towards the Fed’s 2% target, the Fed has now started an easing cycle to address and halt continued economic weakness.
Even as lower inflation and the onset of monetary easing now become tailwinds for the economy, a number of market headwinds still persist. These include: 1) stock valuations that are higher than normal, 2) escalating geopolitical risks, especially in the Middle East, and 3) mounting uncertainty around the outcome and policy implications of the U.S. elections.
One of the biggest concerns surrounding the elections is the potentially negative impact of both candidates’ campaign promises on an already high level of U.S. national debt. Neither candidate has come across as fiscally responsible; their fiscal profligacy is instead projected to increase government spending by an additional $5-7 trillion over the next 10 years.
The national debt is a topic of great interest and worry to many people. We focus exclusively on fiscal policy risks in this article.
We recognize that this is a highly charged and potentially contentious topic. We refrain from any ideological, philosophical, political or moral judgment on the topic; our views are focused only on the likely economic and market impact of the U.S. debt burden.
We interchangeably refer to the national debt as total public debt from hereon and set out to answer the following questions.
- How has the U.S. total public debt grown and who are its main holders?
- How vulnerable are U.S. interest rates to demands for a higher risk premium i.e. greater compensation for bearing risk?
- Has the higher debt level contributed to higher economic growth and national wealth?
- How onerous is the current debt burden and what milestones would further exacerbate fiscal risks?
Sizing the U.S. Debt Burden
The most eye-catching depiction of rising government debt is the nearly six-fold increase in its dollar value over the last 25 years. Total public debt has risen from just under $6 trillion at the turn of the century to almost $35 trillion by June of 2024.
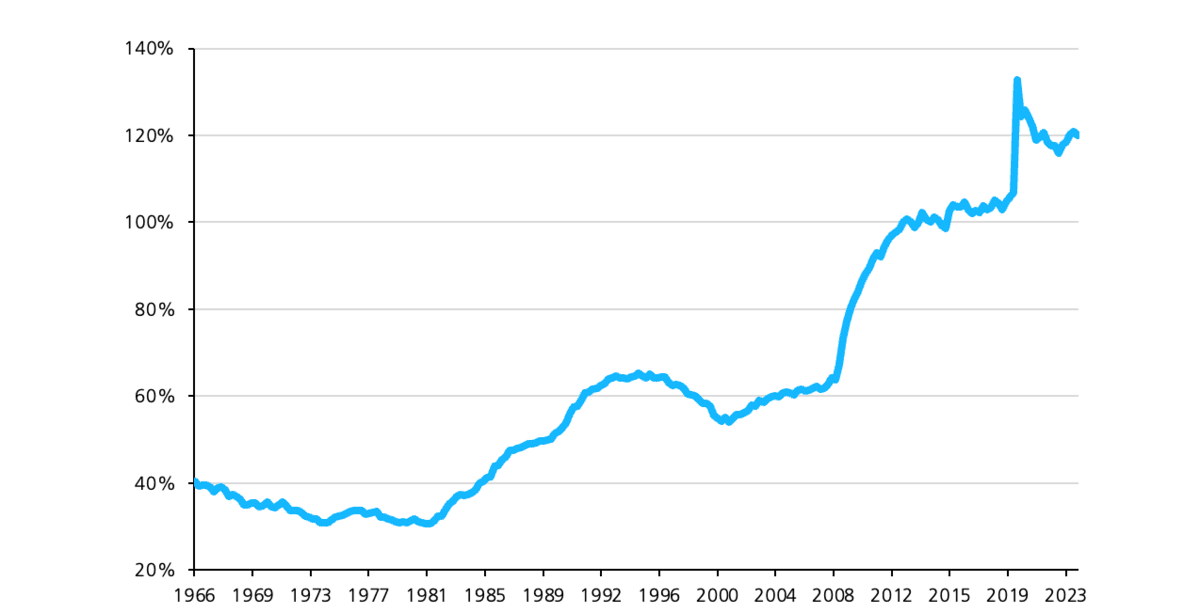
Most of this debt was issued to stabilize the U.S. economy from two devastating shocks during this time – the Global Financial Crisis (GFC) in 2008-09 and the global pandemic in 2020. Since stability of economic growth is a key goal of fiscal policy, the most commonly used metric for the U.S. debt burden is the ratio of total public debt to Gross Domestic Product (GDP). Figure 1 illustrates how total public debt as a percent of GDP has grown over time.
Figure 1: Total Public Debt as a Percent of GDP 
Source: Federal Reserve Board of St. Louis, June 2024
The debt-to-GDP ratio has doubled from almost 60% prior to the GFC in 2008 to around 120% in 2024.
It is interesting to note the different trajectories of the debt-to-GDP ratio after the last two crises.
a. GDP growth after the GFC was anemic as it got dwarfed by an extensive deleveraging cycle.
Slow GDP growth post-GFC caused the debt-to-GDP ratio to spike up rapidly from 60% to 100%.
b. Unlike the GFC which was triggered by unsustainable fundamental excesses, the Covid recession was caused by a global lockdown stemming from health safety considerations. Growth rebounded quickly when economies reopened and was further bolstered by government spending.
Faster post-pandemic GDP growth has contributed to a slower increase in the debt-to-GDP ratio from 100% to 120%.
Most people are alarmed and worried about this rapid increase in the national debt. At first glance, their concerns appear to be well-founded. High and rising government debt could reduce private investment, lead to higher inflation and interest rates, reduce economic growth, weaken the currency, limit future policy flexibility, and create inter-generational inequities.
We analyze these risks by looking at who owns this debt and why, what might make U.S. government debt attractive even at these levels, and whether this level of debt can produce any economic benefits.
Contrary to most prevailing opinions, we believe the fiscal outlook is not nearly as dire. We see no meaningful risk to growth, inflation, interest rates or the dollar in the foreseeable future of 3 to 5 years.
We begin by understanding the composition of the national debt.
Who Owns the U.S. Debt and Why?
Mix of U.S. Debt Holders
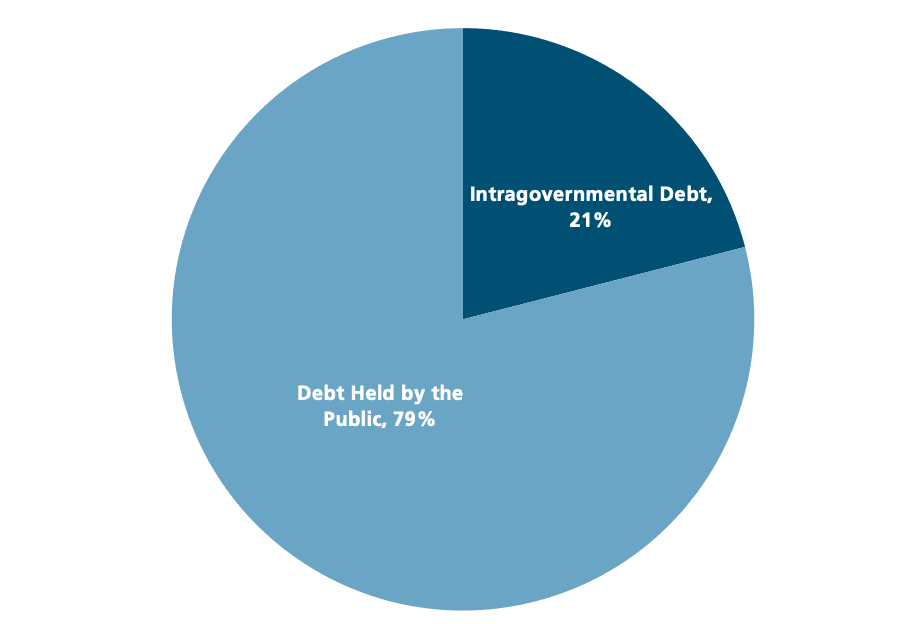
Figure 2 shows the two main categories of the gross national debt: debt held by the public (i.e. debt owed to others) and debt held by federal trust funds and other government accounts (i.e. debt owed to itself).
Figure 2: Composition of Gross National Debt
Source: U.S. Department of Treasury, December 2023
Of the $34 trillion in national debt at the end of 2023, $7 trillion, or 21%, was intragovernmental debt which simply records a transfer from one part of the government to another. Intragovernmental debt has no net effect on the government’s overall finances.
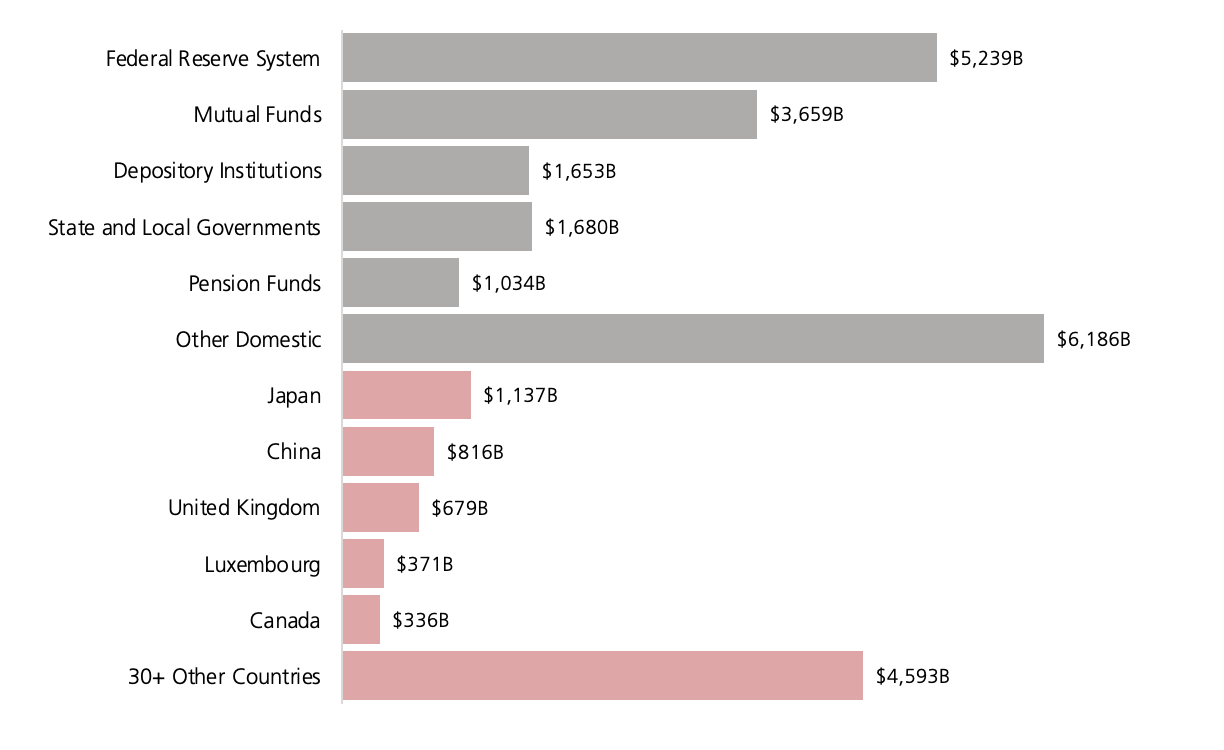
In Figure 3, we take a closer look at the remaining 79%, or almost $27 trillion, of the gross national debt which is held by the public. This portion is generally regarded as the most meaningful measure of debt since it represents Treasury borrowings from outside lenders through financial markets. Debt held by the public was 96% of GDP at the end of 2023.
Figure 3: Composition of Debt Held by the Public
Source: U.S. Department of Treasury, December 2023
Almost 70%, or $19 trillion, of the debt held by the public is in the hands of domestic institutions. The remaining 30%, or $8 trillion, is held by foreign entities, split almost equally between foreign private investors and foreign governments.
We examine the motivations of these entities for holding the national debt now and in the future.
Many Reasons to (Still) Hold U.S. Government Debt
Figure 3 shows that the single largest holder of the U.S. national debt is the Federal Reserve Board. When policy rates reached their zero lower bound in 2020, the Fed lowered long-term interest rates by buying bonds. As a result, the Fed still holds more than $5 trillion of U.S. government bonds. It is safe to assume that the Fed is a reliable lender to the Treasury and is unlikely to trigger a sharp increase in interest rates through its own actions.
Mutual funds own more than $3 trillion of U.S. government bonds to achieve diversification in investment portfolios. U.S. government bonds are among the few investments that can protect portfolios during downturns. The safety and long “duration” of U.S. Treasury bonds typically enable them to appreciate when stocks decline during a selloff.
Corporate and public pension funds typically have long-term liabilities to meet the pension obligations of their retirees. As a safe long-duration asset class, U.S. Treasury bonds are a core building block for pension funds to hedge their long-duration liabilities.
Japan and China are the two largest foreign holders of U.S. government debt. Low domestic interest rates in Japan make U.S. bonds particularly appealing for Japanese investors. China runs a large current account surplus, primarily from its favorable trade imbalance of exporting more than importing. China is a natural buyer of safe-haven assets for its more than $3 trillion of foreign exchange reserves.
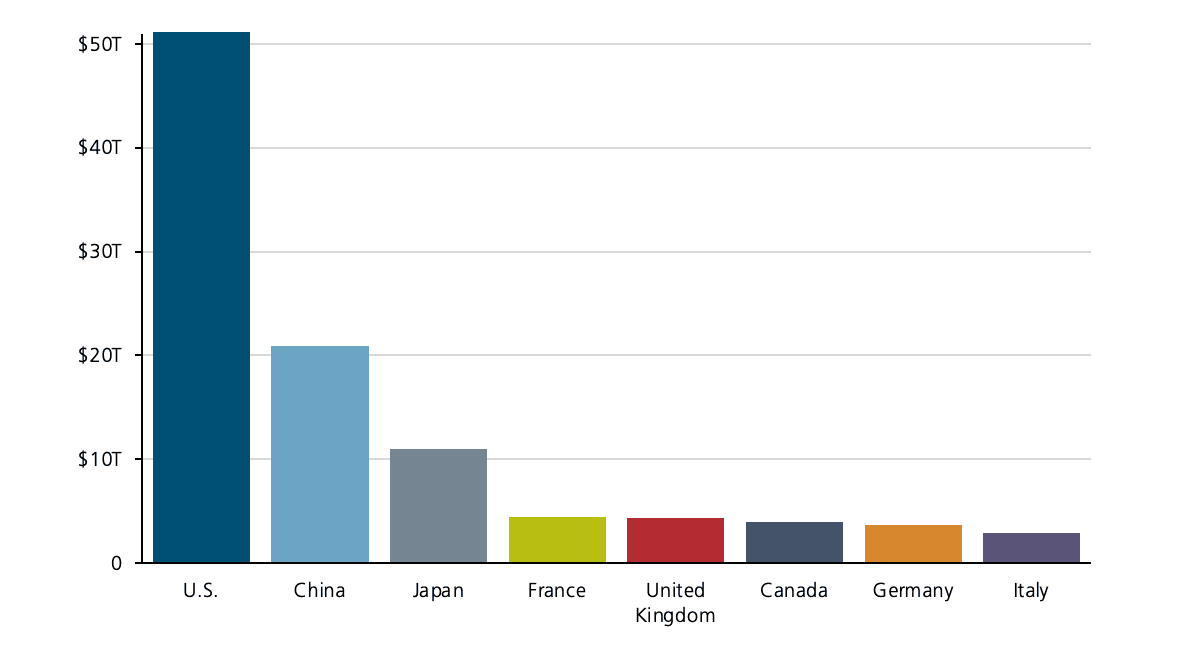
Unlike the U.S. consumer, foreign consumers tend to save more. This results in a glut of global savings that is simultaneously seeking safety, quality, income, and liquidity. There is no other bond market in the world that offers the size and safety of the U.S. bond market. Figure 4 illustrates the relative size of the world’s largest bond markets.
Figure 4: The World’s Top Bond Markets
Source: BIS, Visual Capitalist, Q3 2022
The U.S. bond market is valued at more than $50 trillion and represents nearly 40% of the global bond market. China’s bond market carries risks of fundamental weakness, currency depreciation and capital controls. The Japanese bond market offers unattractively low interest rates. The remaining bond markets are so small that they do not offer a viable alternative to U.S. bonds.
Now, we take a quick look at the empirical evidence on risks associated with high debt and deficit levels.
High debt and deficits are intuitively associated with high inflation and interest rates. It seems reasonable that greater government spending could spur demand and trigger inflation; it could also curtail private investments from the “crowding out” effect of higher interest rates. Any subsequent tightening to tame inflation would then further slow growth down.
It turns out that this storyline has indeed played out a number of times in high-inflation developing economies. However, it may surprise many of our readers to learn that this is not the norm in low-inflation advanced economies 1. It certainly hasn’t been the case in the U.S. for several reasons.
The U.S. central bank is highly regarded and enjoys strong global credibility. The Fed successfully kept long-term inflation expectations anchored even as inflation reached 9% in 2022. The big increase in total public debt to GDP from 60% to 100% in the aftermath of the GFC didn’t stoke inflation in the ensuing economic recovery.
The U.S. also has solid governance mechanisms to guard against excessive fiscal dominance; two political parties and two independent chambers of Congress provide institutional checks and balances. The U.S. dollar enjoys significant advantages from its status as the world’s reserve currency. The U.S. is home to many of the most innovative and profitable companies in the world, is blessed with abundant natural resources, and boasts a strong military presence.
We are mindful that high levels of borrowing carry inherent risks and that they cannot keep growing endlessly without consequences. However, at this time, we are hard-pressed to pinpoint a specific threshold at which U.S. government debt would become undesirable or untenable.
From a strictly economic perspective, we believe the current level of U.S. national debt is not particularly problematic.
i. Excluding intragovernmental debt and debt held by the Fed, the U.S. debt-to-GDP ratio falls from 120% to 77%.
ii. The remaining domestic and foreign investors have strong incentives to hold U.S. bonds for safety, liquidity, diversification and hedging needs; in any case, there is no viable alternative to the U.S. bond market.
We conclude with a quick look at how the recent increase in total public debt has coincided with economic or market gains.
National Debt and National Wealth
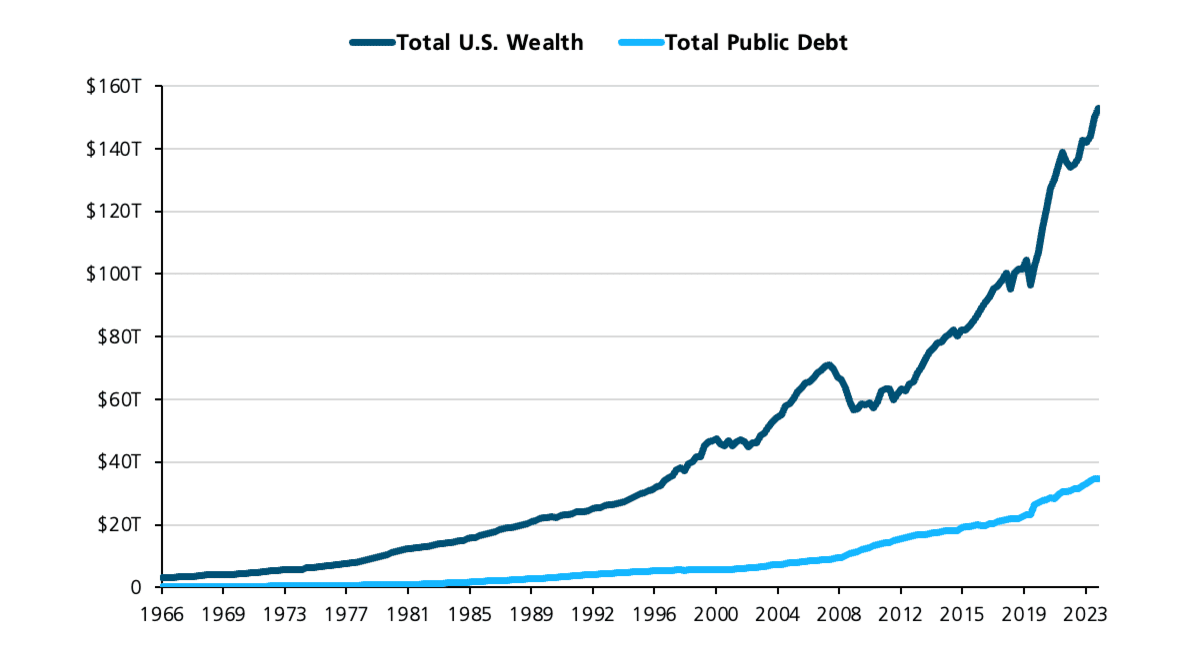
In the four years from 2019 to 2023, total public debt rose from $23.2 trillion to $34 trillion, while nominal GDP grew from $21.9 trillion to $28.3 trillion. The post-Covid annual growth rate of 6.5% in nominal GDP was a lot higher than the meager 4% annual growth from 2009 to 2019.
A number of factors were different in these two periods. A long cycle of deleveraging restrained growth in the post-GFC recovery. An equally powerful theme in this recovery is the significant, but still nascent, impact of technology and AI on the economy and markets. Over the last few years, pandemic-related health safety needs have spurred numerous technological innovations and inventions.
There is a school of thought that our current GDP measurement may not fully capture all the benefits of technological advancements. We will explore this theme in a different setting at a different time. But for now, this notion prompts us to examine the association of debt levels with other measures of well-being or monetary gains.
In this setting, we identify the U.S. national wealth as a useful measure of prosperity. National wealth aggregates the total nominal value of assets and liabilities across all sectors of the U.S. economy. These assets include real estate, corporate businesses and durable goods; liabilities include foreign claims on U.S. assets.
Figure 5 shows the rapid rise in both national wealth and national debt.
Figure 5: Growth of National Wealth and National Debt
Source: Federal Reserve Board of St. Louis, June 2024
The two biggest components of national wealth, by far, are real estate and domestic businesses. We have long argued that one of the key factors behind the resilience of the U.S. consumer is the wealth effect. Home prices and stock prices are at all-time highs and, as a result, so is household net worth. The top quintile of households by income, who account for more than half of all consumer spending, have particularly benefited from the wealth effect.
Several factors have contributed to the rise in national wealth. It is difficult to ascertain exactly what role the fiscal stimulus may have played in its recent rapid growth. However, we do believe that fiscal policy has contributed in some positive manner to the growth in national wealth.
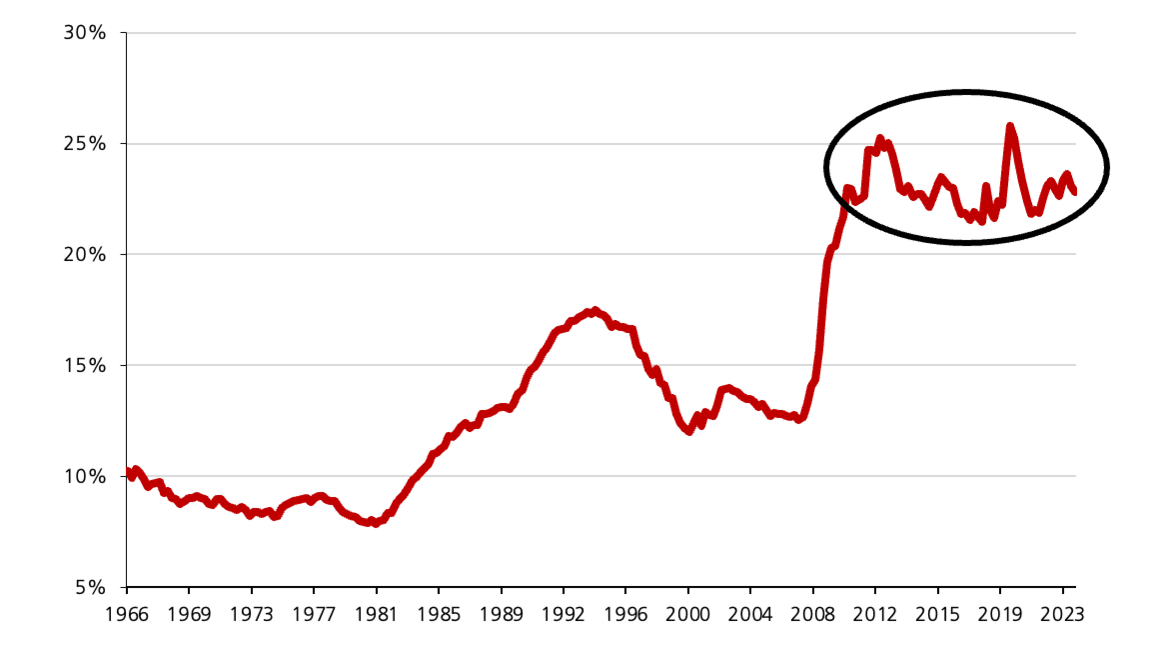
We look at national debt as a percent of national wealth in Figure 6.
Figure 6: Steady Debt to Wealth Ratio in Last 15 Years
Source: Federal Reserve Board of St. Louis, June 2024
The dollar value of both the national debt and national wealth has nearly tripled from 2009 onwards. As a result of the synchronized growth rate in both metrics, total national debt has held steady between 22-25% of national wealth from 2009.
To the extent that the pandemic simultaneously unleashed both significant fiscal stimulus and highly profitable technological innovation, national debt and wealth have moved in tandem. By this yardstick, the U.S. national debt burden looks less onerous.
Summary
We recognize how intensely people feel about the national debt burden. We also understand that there are several intuitive reasons to worry about it. We pass no judgment to either condone or condemn it in this article; we simply examine its likely economic and market impact in the coming years.
We summarize the many reasons why investors hold U.S. government debt and will likely continue to do so on similar terms.
- High credibility of monetary policies
- Unparalleled size, safety, quality and depth of the U.S. bond market
- U.S. dollar as the world’s reserve currency
- Lack of viable alternatives for domestic and foreign investors
- Diversification and hedging needs of long duration asset owners
- Solid governance against fiscal dominance
- Global glut of savings
- Disinflation from technology
- Vibrant economy and formidable military
We do not expect the national debt burden to create meaningfully higher inflation, higher interest rates or a weaker dollar in the foreseeable future of 3 to 5 years.
We remain vigilant and alert, but we maintain our conviction that the U.S. economy continues to head steadily towards a new equilibrium. We do not anticipate any imminent major shocks in this new economic cycle and bull market.
1Footnote: “Fiscal Deficits and Inflation”, Luis Catao and Marco Terrones, International Monetary Fund
To learn more about our views on the market or to speak with an advisor about our services, visit our Contact Page.
Excluding intragovernmental debt and debt held by the Fed, the U.S. debt-to-GDP ratio falls from 120% to 77%.
The remaining investors have strong incentives to hold U.S. debt for safety, liquidity, diversification and hedging needs.
We do not expect the national debt burden to create meaningfully higher inflation, higher interest rates or a weaker dollar in the foreseeable future of 3 to 5 years.
From Investments to Family Office to Trustee Services and more, we are your single-source solution.


