Inflation And The Yield Curve
INTRODUCTION
The market turmoil of 2022 stands in sharp contrast to the Utopian backdrop of stimulative policy, low volatility and high returns seen in 2021. Persistently high inflation has caused an abrupt pivot in monetary policy. Fiscal stimulus is poised to disappear in 2022 and a couple of new global risks have recently emerged to spark fears of a recession.
The Fed announced its trifecta of hawkish policy actions in the form of tapering, rate hikes and quantitative tightening in early 2022. It has now completed tapering, implemented one 25 basis point rate hike in March and signaled the beginning of balance sheet reduction from May onwards.
The Russian invasion of Ukraine on February 24th triggered another upward spiral in inflation through a rise in food and energy prices. More than two months later, the war shows no signs of abating.
And finally, China has responded to its most recent outbreak of Covid cases with sustained lockdowns in major cities and ports. The curtailment of manufacturing and shipping activity will likely prolong supply chain disruptions and sustain inflationary pressures.
U.S. interest rates have moved dramatically in response to proposed Fed policy actions. Shorter-term interest rates rose significantly towards the end of the first quarter and even inverted the yield curve in early April.
Inflation has now become even more conspicuous as the main economic and market risk. High inflation can act as a tax and slow growth by itself. It also increases the risk of a policy misstep, where overly aggressive tightening by the Fed may trigger a recession.
Both of these possibilities were potentially reflected in the recent inversion of the yield curve. Yield curve inversions have historically been useful recessionary indicators. We focus on the key topics of inflation and the yield curve to reassess the outlook for growth. Along the way, we pose and answer the following questions.
- Can the Fed alone bring inflation down to target levels at this point?
- Could inflation roll over on its own? If so, when and to what extent?
- What is the typical lead time from the inversion of the yield curve to the onset of a recession?
- Has extraordinary central bank policy distorted the information content of the yield curve?
- What other factors may be driving the recent decline in the term premium?
- Does a low term premium make yield curve inversions statistically more likely?
INFLATION TRENDS AND IMPLICATIONS
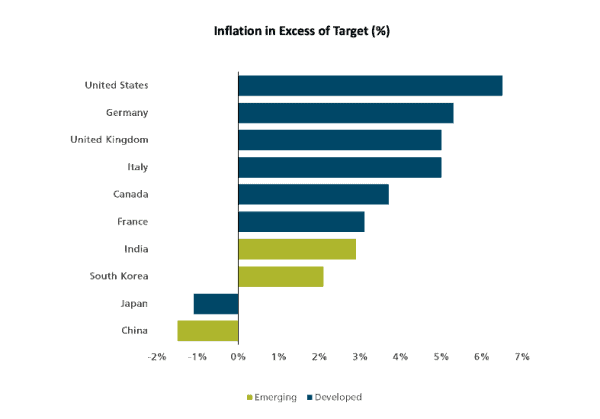
High inflation is now pervasive and ubiquitous. It has become a global phenomenon for several reasons. The coronavirus pandemic was a global crisis. The war in Ukraine has increased commodity prices worldwide. And rising Covid cases in China will affect global supply chains. Figure 1 shows how high inflation is in excess of levels targeted by domestic central banks.
Figure 1: Global Inflation in Excess of Target (%)
Source: Whittier, FactSet, Federal Reserve Board, ECB, Bank of Canada, Reserve Bank of India, Bank of Korea, BoJ, PIMCO
Figure 1 shows that the 8.5% U.S. CPI inflation in March was 6.5% above the Fed’s target level of 2% inflation. The experience is similar across both developed and emerging economies with Japan and China being the notable exceptions.
A closer look at U.S. CPI inflation reveals some interesting trends. The post-pandemic spike in inflation has been bookended by abnormal increases in vehicle prices early on and then energy prices most recently. In a curious case of symmetry, energy prices declined last year when vehicle prices shot up in April 2021. A year later, vehicle prices declined as energy prices skyrocketed in March 2022.
In fact, energy and vehicle prices account for almost 45% of CPI inflation over the last 12 months.
One may reasonably expect their outsized impact on inflation to diminish once supply chains and energy markets are restored to some level of normalcy.
Investors have focused increasingly on the adverse impact of higher food and energy prices on overall consumer spending and economic growth.
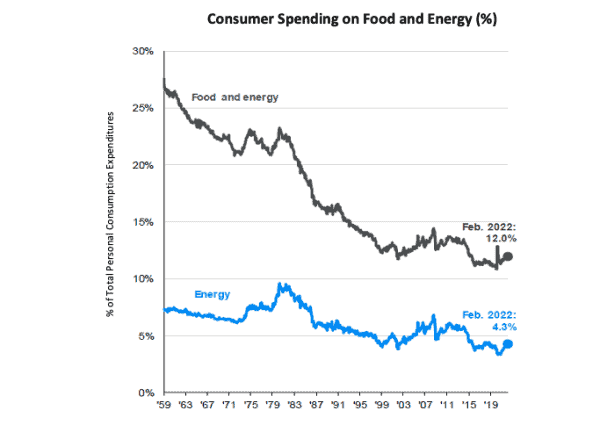
We examine this thesis in Figure 2 which shows domestic spending on food and energy as a percent of total personal consumption expenditures.
Figure 2: Consumer Spending on Food and Energy (%)
Source: J.P. Morgan Asset Management
It is encouraging to note that spending on Energy today is only 4% of the total and less than half of what it used to be in the 1980s. Combined spending on Food and Energy today is also less than half of what it used to be in the 1960s.
We offer the counter perspective that higher spending on Food and Energy may have a smaller impact on overall consumer spending than many may believe.
We finally turn to the important question of whether U.S. inflation may roll over by itself in the coming months. We pose the question not out of fond hope, but based instead on the cumulative rebalancing of global supply and demand that has taken place over the last several months.
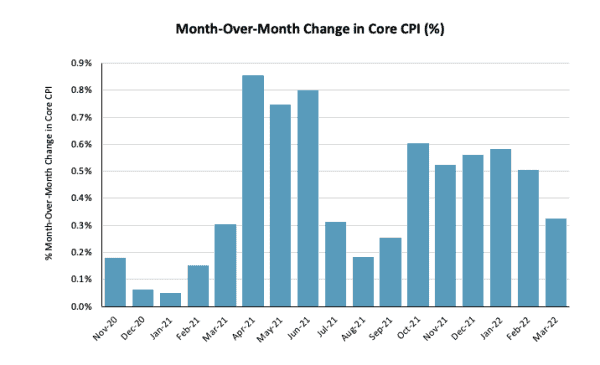
We look for signs of a natural deceleration in core CPI in Figure 3.
Figure 3: Month-over-Month Change in Core CPI (%)
Source: St. Louis Federal Reserve
Figure 3 shows an encouraging decline in the levels of monthly change in core CPI.
Core CPI has increased at a slower pace in each of the last two months compared to the prior four months. Monthly changes from April to June 2021 were also a lot higher than those registered in recent months.
Figure 3 shows that the first big increase in the post-pandemic bout of inflation came in April 2021. Starting next month in April 2022, it is likely that favorable “base effect” comparisons from a year ago may now mitigate annual inflation measurements.
We observe separately that a number of recent inflation drivers like gasoline futures, used car prices and freight rates have all rolled over in recent weeks.
We believe that inflation will likely plateau in the coming months. However, the ongoing war in Ukraine and China’s lockdowns to combat Covid will continue to dislocate commodity, manufacturing and shipping supply chains. As a result, inflation will recede slowly and remain above target in 2022 and 2023.
INFLATION AND THE FED
The misguided belief on the Fed’s part last year that inflation would be transitory leaves it in a difficult spot now.
The war in Ukraine and China’s recent lockdowns have exacerbated inflationary pressures in the near term even as global growth slows under the weight of higher inflation and rising interest rates.
The Fed is now left to pick between the lesser of two evils. Try to control inflation and risk a recession or try to avoid a recession and risk a long inflationary spiral.
We believe that the Fed cannot afford to back off from its tightening agenda. They are already late in the process and simply cannot fall any further behind.
Having said that, it is highly unlikely that Fed policy by itself can bring inflation all the way down to target levels.
Our view is based on the simple arithmetic of monetary policy. The latest core PCE inflation reading is 5.4%. Assume for a moment that inflation doesn’t naturally roll over or supply chains don’t heal any further. In this setting, the Fed funds rate would have to go to 6% or 7% for monetary policy alone to push inflation all the way down to the target 2% level.
We do not expect the Fed to engage in such Draconian tightening. It will, nonetheless, push forward aggressively to achieve another outcome which is more modest and realistic.
We know how actual inflation can spiral out of control when inflationary fears get embedded into inflation expectations. The Fed’s recent rhetoric is aimed squarely at preventing current inflation from becoming anchored into inflation expectations.
In a sign of some modest success, longer-term inflation expectations rate still remain fairly low at around 2.5% as of mid-April.
We conclude this section with two key takeaways. At this point, the Fed needs help from the real economy to bring inflation gradually down to target. In the meantime, it seeks to establish enough credibility to manage long-term inflation expectations.
YIELD CURVE INVERSIONS
The recent inversion along most of the U.S. yield curve has sparked fears of a recession in the near term. The spread between the 10-year U.S. Treasury yield and the 2, 3, 5 and 7-year bond yields became negative at the beginning of April.
The 2-10 inversion is generally considered a reliable recessionary indicator. Inversions are generally observed when tight monetary policy leads to fears of a subsequent economic slowdown. In this setting, long-term interest rates begin to decline and end up below short-term rates.
Each of the last seven recessions was preceded by a 2-10 inversion. It is important to note that while every recession has been preceded by a 2-10 inversion, not every inversion has led to a recession.
We note that the yield curve inversions of early April lasted just a few days and have since reversed out at the time of writing.
We, nonetheless, explore the topic in light of renewed recessionary fears and in the event they re-appear in the bond market.
Lead Times and Alternate Measures
The 2-10 inversion is a leading indicator of recessions. Historical data suggests that a negative 2-10 yield spread tends to be quite early and leads an eventual recession by about 20 months on average. This lead time has ranged between 10 and 35 months at either extreme.
It is interesting to note that stock market peaks are observed closer to the onset of recessions. In other words, the 2-10 inversion typically leads the peak in stock prices as well, e.g. stock prices can go higher after the 2-10 spread inverts.
The slope of the yield curve can also be measured by the spread between the 10-year and 3-month Treasury yields. We designate this as the 3m-10y spread from here on and contrast it to the 2-10 spread discussed above.
The 3m-10y is also a reliable recession indicator. Its historical track record suggests that a recession ensues about a year after the 3m-10y spread stays inverted for about two months.
Even as the 2-10 spread became inverted, the 3m-10y spread has remained steeply positive. Proponents of a continued expansion in the cycle point to the 3m-10y spread as a rebuttal of the recession thesis.
We look at one more variation of the 3-month Treasury yield before interpreting these divergent signals.
Near-Term Forward Spread
Fed researchers have pointed out that an even more useful recessionary indicator from the yield curve is derived from the 3-month Treasury yield. The near-term forward spread is defined as the difference between the implied forward rate on 3-month Treasury bills six quarters from now and the current yield on the 3-month Treasury bill.
When this spread becomes negative, the market expects monetary policy to ease in response to the likelihood of a recession. However, the near-term forward spread is also steeply positive at this point.
Both the positive 3m-10y spread and positive near-term forward spread simply reflect the reality of a new Fed tightening cycle, e.g. the Fed plans to hike aggressively in the coming months.
How should one reconcile a flat or slightly negative 2-10 spread with a steeply positive 3m-10y spread and a steeply positive near-term forward spread?
The two 3-month indicators tend to assess the odds of a recession in the next twelve months or so. The 2-10 spread tends to have a longer lead time, which is closer to two years.
We believe the market is suggesting that a recession is less likely in the next one year than it may be in later years.
Inversions and Low Term Premium
We close out our yield curve discussion by examining an unconventional link between inversions and the level of term premium.
Treasury yields are derived from two components – expectations of the future path of short-term Treasury bonds plus a Treasury term premium.
Simply stated, the term premium is the compensation that investors demand to bear interest rate risk in holding long-term bonds. While intuitive to grasp, the term premium is not easy to measure. It is unobservable and must be estimated from the yield curve.
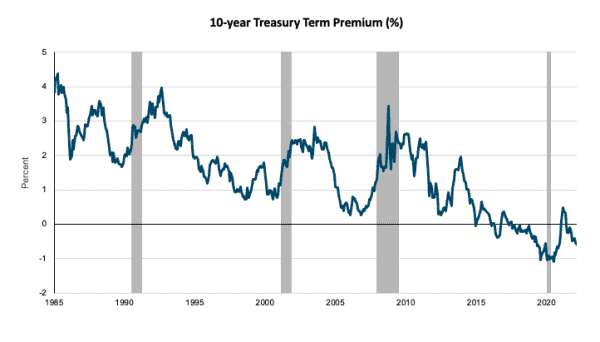
Figure 4 shows a popular measure of the term premium compiled by researchers at the Federal Reserve Bank of New York.
Figure 4: 10-Year Treasury Term Premium
Source: Adrian, Crump and Moench, Federal Reserve Bank of New York
The secular decline in the term premium shown above has now become a topic of great interest and debate.
Figure 4 shows that the average term premium since 1985 has been around 150 basis points. In contrast, the average term premium over the last 10 years has been close to 0.
A number of reasons have been advanced to explain this decline in the U.S. term premium.
- Central bank asset purchases
- Glut of global savings
- Interest in dollar-denominated assets from foreign investors
- Demand for longer-dated assets to hedge long duration institutional liabilities
- Disinflationary pre-pandemic pressures and forward guidance
It is easy to understand how asset purchases (quantitative easing) by the Fed for over a decade may well have distorted the bond market. It is possible that unrelenting demand from a large price-insensitive buyer can dislocate prices from fundamental values.
U.S. Treasuries are also a preferred destination for a glut of global savings, foreign investors and institutions such as pension funds who need to hedge long duration liabilities. And finally, from a sheer risk premium perspective, the long trend of disinflation prior to the pandemic along with enhanced Fed signaling and forward guidance have reduced interest rate volatility.
The topic of term premiums becomes relevant in the following context.
Fed researchers have also studied the impact of this decline in term premium on the likelihood of yield curve inversions.* They conclude that inversions are 4 to 5 times more likely statistically at today’s low level of the term premium than they are at their historically higher levels.
Yield curve inversions in a regime of low term premium may, therefore, carry less fundamental information about growth and may prove to be less reliable as a recessionary indicator.
TAILWINDS TO GROWTH
We have so far addressed several recent concerns related to a potentially higher risk of recession. We comment briefly on some of the continued tailwinds to the U.S. economy to balance out our growth outlook.
We begin with some brief comments on the housing sector. There are growing concerns that rising mortgage rates and falling affordability will soon make housing a headwind for the U.S. economy.
We allay those concerns at least partially by drawing the following comparisons to the Financial Crisis.
- Adjustable rate mortgages are a smaller percent of mortgage applications now (< 10% vs. > 30%)
- Home inventory in terms of months of supply is lower now (< 2 vs. > 10)
- Household debt to income ratios are lower now (~ 100% vs. > 130%)
In addition, the labor market is strong and close to full employment. Consumer balance sheets are healthy. Consumer net worth is more than $30 trillion higher than it was prior to the pandemic. Consumer incomes are high. The U.S. consumer is still strong.
Credit spreads have also remained fairly narrow so far. And S&P 500 earnings estimates for calendar years 2022 and 2023 have continued to rise through April.
In light of these strong fundamentals in the U.S. economy, we believe a soft landing is more likely than a recession in 2022.
SUMMARY
We examine the latest developments on inflation, Fed policy and interest rates to reassess our economic outlook. Our views are summarized below.
We believe:
Inflation and the Fed
- Inflation remains the biggest economic and market risk
- Inflation may peak soon, but will remain above target in 2022 and 2023
- War in Ukraine and Covid cases in China will impede the recovery of supply chains
- Fed policy alone cannot lower inflation to target
- Fed signaling is key to managing longer-term inflation expectations
Yield Curve
- Term premium in the last decade has been unusually low and close to zero
- Yield curve inversions are statistically more likely when the term premium is low
- Yield curve indicators may now be a less reliable recessionary signal
Growth
- A strong labor market and U.S. consumer bode well for the U.S. economy
- Low credit spreads and rising earnings estimates do not signal any major concerns
- Recession risks may not be as elevated as many fear
We, nonetheless, live in complicated times. We acknowledge that there are a number of complex forces at play in the current macroeconomic backdrop. We are constantly monitoring new information for any signs that may refute our constructive view on the economy.
We continue to invest client portfolios with caution, vigilance and a focus on high quality securities.
*Haltom, Wissuchek and Wolman, Federal Reserve Bank of Richmond
Inflation may peak soon, but will likely remain above target in 2022 and 2023.
In a regime of low term premium, yield curve inversions may prove to be a less reliable recessionary signal.
In light of strong fundamentals in the U.S. economy, we believe a soft landing is more likely than a recession in 2022.
From Investments to Family Office to Trustee Services and more, we are your single-source solution.

