The stock market’s smooth upward trajectory in the first half of 2019 was interrupted by a volatile third quarter. Stocks were largely unchanged as prices fluctuated within a trading range during the quarter. The S&P 500 index was up 1.7%, the Russell 2000 index fell by –2.4% and the MSCI All Country index declined by –0.6%.
Most of the price swings came from alternating views about a recession as trade tensions ebbed and flowed. Trade worries became more pronounced after China announced retaliatory tariffs on $75 billion of U.S. imports on August 23rd. On the same day, the U.S. countered by raising existing and proposed tariffs by an additional 5% on a staggered schedule. The trade war deescalated towards the end of the quarter as the two countries agreed to a meeting in early October to resolve differences.
Trade, however, remains just one of the many issues that investors continue to fret about. These include high levels of corporate and government debt, the growing ineffectiveness of central banks and their monetary policies, and far-flung geopolitical risks from an impeachment inquiry in the U.S. to turmoil in Europe and the Middle East.
Investor Sentiment
We focus on investor mindset to highlight an interesting, and counter-intuitive, theme in the financial markets today. With the S&P 500 up 20% so far in 2019, many are concerned that investors have become overly optimistic and perhaps even euphoric. However, our assessment of investor mood runs counter to this popular belief; investors are far from optimistic despite the strong stock market rally.
We begin with the role of sentiment in investment decision-making and present a broad overview of what traditional indicators are signaling about investor risk preferences.
Investor sentiment has come to be recognized as a contrarian indicator. When risk aversion is low and investors are optimistic, they are more likely to extrapolate recent good news and ignore future bad news. In fact, excessive optimism is often seen as a pre-condition of an impending recession. In the past, recessions and bear markets have generally been preceded by a sense of calm and excitement that is derived from complacency, greed or exuberance. These emotions have then led investors to become irrational and build excesses in leverage and valuations.
We examine the different ways in which investor sentiment can be inferred from market prices and conclude that current investor sentiment is distinctly different. Risk aversion is high and investors are pessimistic, nervous and perhaps even fearful.
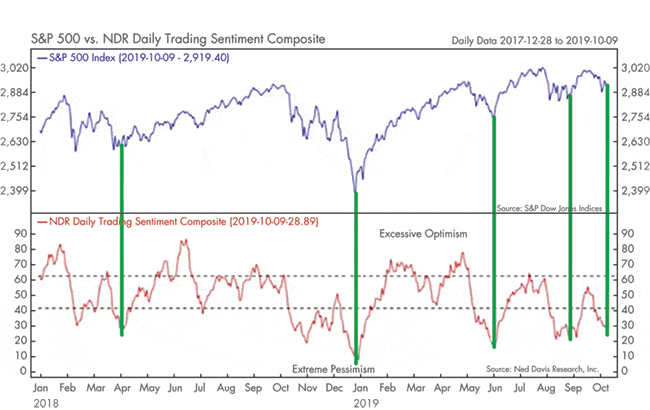
In the last several months, these concerns have receded periodically as shown in Figure 1 and allowed the market to advance by climbing one wall of worry after another.
Figure 1: S&P 500 and Sentiment Composite

Based on the inherently contrarian nature of the signal, we believe that the current negative sentiment may argue against a bear market.
Our assessment of sentiment indicators is described in the following sections.
Unusually low bond yields
We have written extensively in prior articles about the startling decline in interest rates this year. After rising above the 3% level about a year ago, the 10-year Treasury bond yield fell below 1.5% in the third quarter. Along the way, the yield curve became inverted as the spread between long-term and short-term interest rates turned negative.
A number of factors have contributed to the sharp fall in interest rates. Clearly, slower growth and lower inflation have been fundamental drivers of lower rates. Yet, they haven’t been so low to fully justify the sharp fall in interest rates. Real GDP growth so far in 2019 is above 2% and inflation is close to the Fed target of 2%. As a result, there are quite likely other factors at play along the lines of central bank policy and investor behavior.
The decision by central banks to explicitly buy long-term bonds as a way to stimulate the economy has pushed interest rates lower. We also infer that a portion of the decline in interest rates is attributable to abnormal changes in risk aversion.
As investors cater to their worst fears about the economy, they have moved money from stocks to bonds in a classic, but pronounced, flight to safety. The cost of this safety and liquidity has come in the form of higher bond prices and lower yields as a consequence. We believe these unusually low bond yields are meaningfully symptomatic of negative investor sentiment.
Sector and style performance
Investor sentiment reflects itself in the markets through a risk-on or risk-off outcome. In the former instance, higher risk assets and securities perform better. Risk-on outcomes typically include stocks over bonds, small cap stocks over large cap stocks and cyclical stocks over defensive stocks. Investors tend to pursue risk when they are optimistic about future growth.
When risk aversion is high and sentiment is negative, investors price in a risk-off scenario where bonds do well, large cap outperforms small cap and defensives do better than cyclicals.
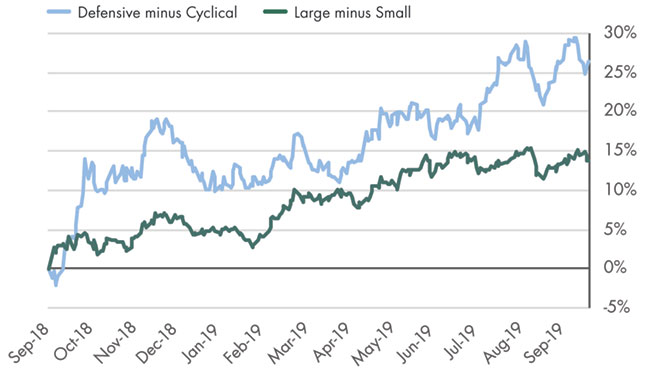
We take a closer look at the action inside the U.S. stock market in Figure 2 and examine performance in 2019 by factors of size and style.
Figure 2: Size and Style Price Performance

For our discussion here, large cap stocks are defined by the S&P 500 index and small cap stocks by the S&P 600 index. Defensive stocks are represented by the Consumer Staples and Utilities sectors in equal weights and cyclical stocks include Industrials, Energy and Finance in equal proportions.
Despite the 20% gain in the S&P 500 over the last three quarters, the results in Figure 2 curiously indicate an underlying pattern that is more reflective of a risk-off mindset. We observe that the winners in our comparisons are large cap and defensive stocks. We also know that they tend to perform better when investor sentiment is more pessimistic than optimistic.
As a result, we suspect that risk aversion may be higher and sentiment may be more negative than many believe to be the case
Recent IPOs
Let’s stay with price-related metrics to further gauge investor sentiment. A clear sign of frothy markets is the exuberance with which an Initial Public Offering (IPO), when a private company goes public, is embraced. As a rule of thumb, the performance of IPOs is correlated with investor sentiment; they perform better when investors are more optimistic.
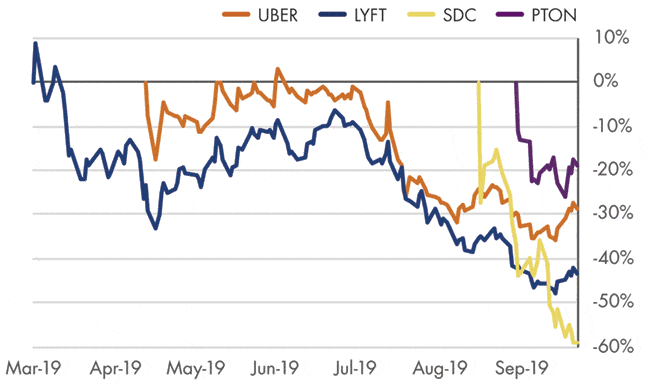
But the difficulties of recent IPOs in the public markets have now been well-documented. Consider the post-IPO performance of Uber, Lyft, SmileDirectClub and Peloton in Figure 3.
Figure 3: Price Performance of Recent IPOs

We can see that these recent IPOs have struggled soon after their issuance. They are also generally characterized by high valuations on revenues, lack of current profitability and, in the case of Uber and Lyft, even a lack of visibility to a path towards future profitability. The one notable exception in the IPO world this year is Beyond Meat where the company is currently profitable and an early mover in a massive total addressable market of plant-based protein substitutes for meat.
The discerning and conservative response from investors to these company fundamentals argues against excessive optimism. It is another data point to suggest that risk aversion is high and investor enthusiasm is low.
Risk indicators
We conclude our review of sentiment metrics with a mix of risk indicators derived from different sources – market prices, asset flows and hedge fund surveys.
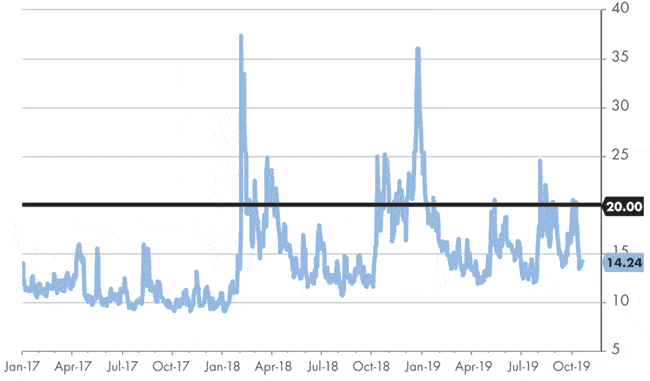
The Chicago Board Options Exchange calculates the VIX index which is a measure of the expected volatility of U.S. stocks over the near term. The VIX index is also referred to as the “fear gauge” since it captures investor mood. When VIX is high, investors are deemed to be fearful; when VIX is low, investors are likely to be complacent. The recent performance of the VIX index is shown in Figure 4.
Figure 4: VIX Index from 2017 to 2019

We can see that VIX has breached the psychologically important level of 20, which is normally associated with investor fear, more often in 2018 and 2019 than it did in all of 2017. Despite dizzying fluctuations, we can surmise that VIX has been more elevated than average and, therefore, investor sentiment has been more subdued than average in recent months.
Investor concerns are also reflected in mutual fund flows and hedge fund surveys. Bank of America Merrill Lynch estimates that flows into equity and commodities funds have been negative in 2019 through mid-October at -1.2% and -1.8%, respectively. On the other hand, money-market and bond funds have seen inflows of +2.0% and +3.0%, respectively.
The pattern of asset flows away from risky assets and into less risky assets is another sign of high risk aversion. And finally, in support of negative sentiment, hedge fund allocations to equities based on surveys by Evercore ISI remain close to all-time lows.
Summary
We observe that investor sentiment has been unusually pessimistic for lengthy periods in recent months. The irrational exuberance that normally precedes recessions and bear markets seems to be missing at this point of time. Since sentiment has long been viewed as a contrarian indicator, high risk aversion and low investor elation may counter-intuitively bode well for risky assets as we close out 2019.
However, we do note that growth needs to revive in 2020 for the stock market to post gains moving forward. We remain vigilant as ever and focus on high quality companies with strong cash flows and sustainable competitive advantages.
“Investors are far from optimistic despite the strong market rally this year.”
“We believe that the current negative sentiment may argue against a bear market.”
From Investments to Family Office to Trustee Services and more, we are your single-source solution.

