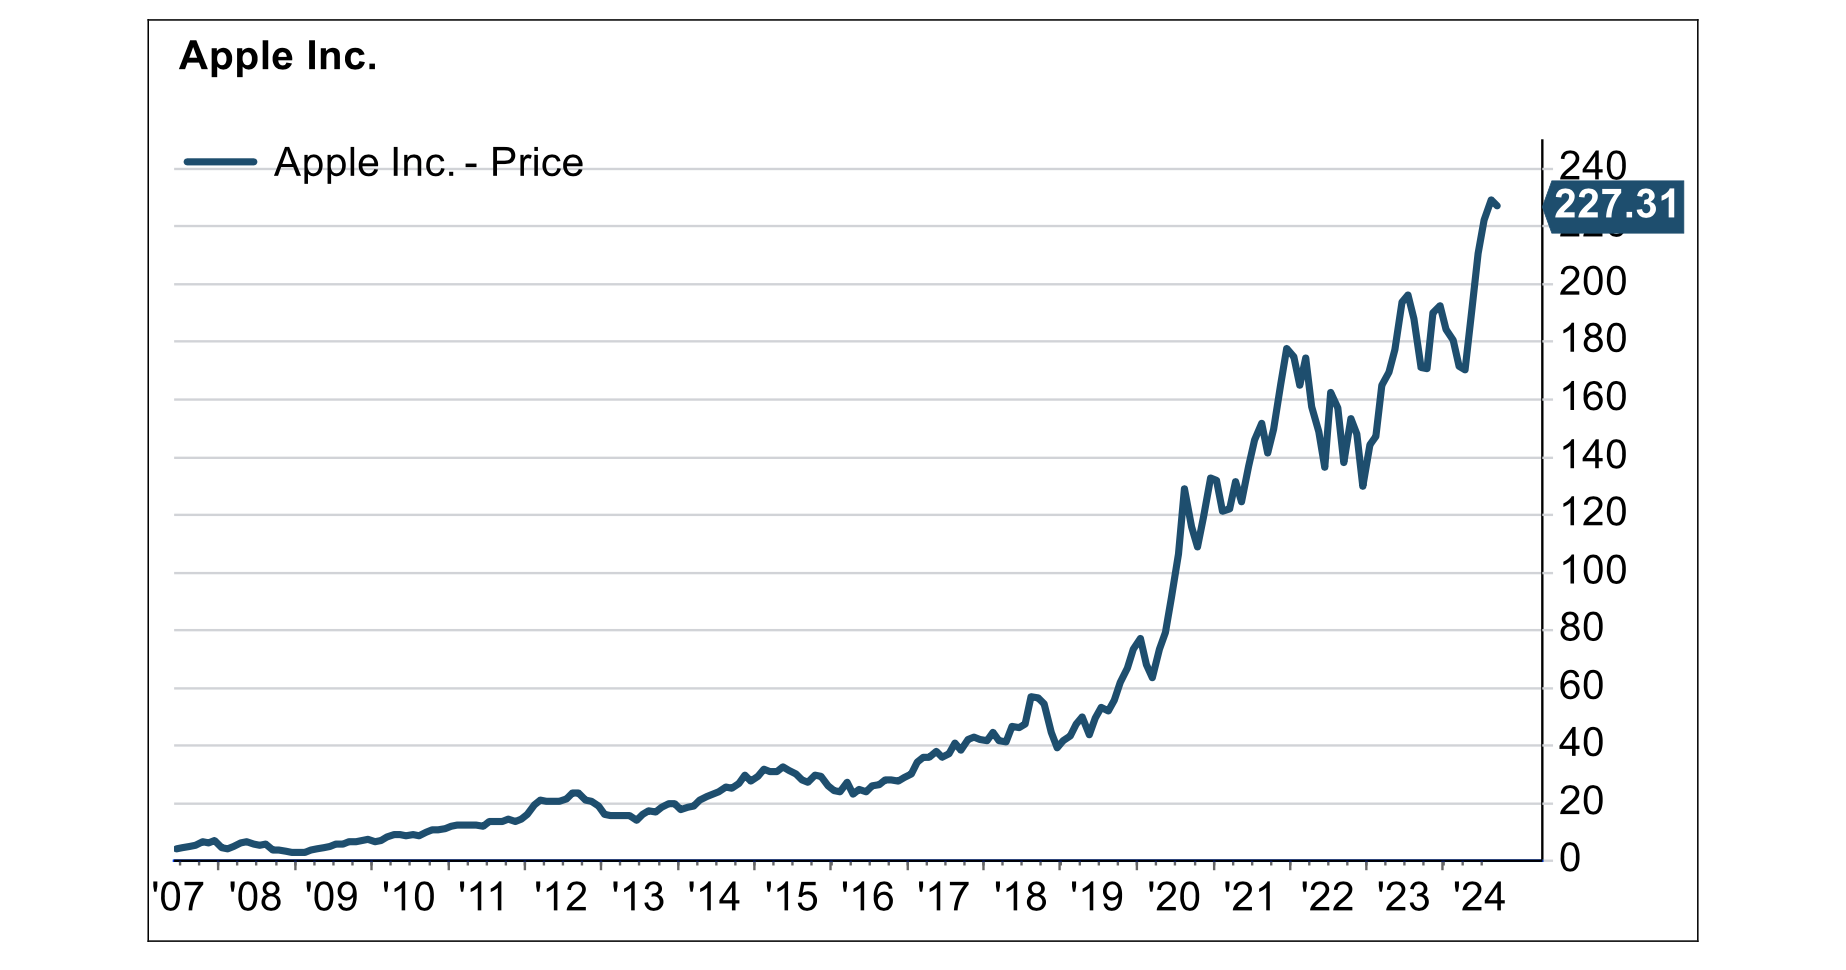
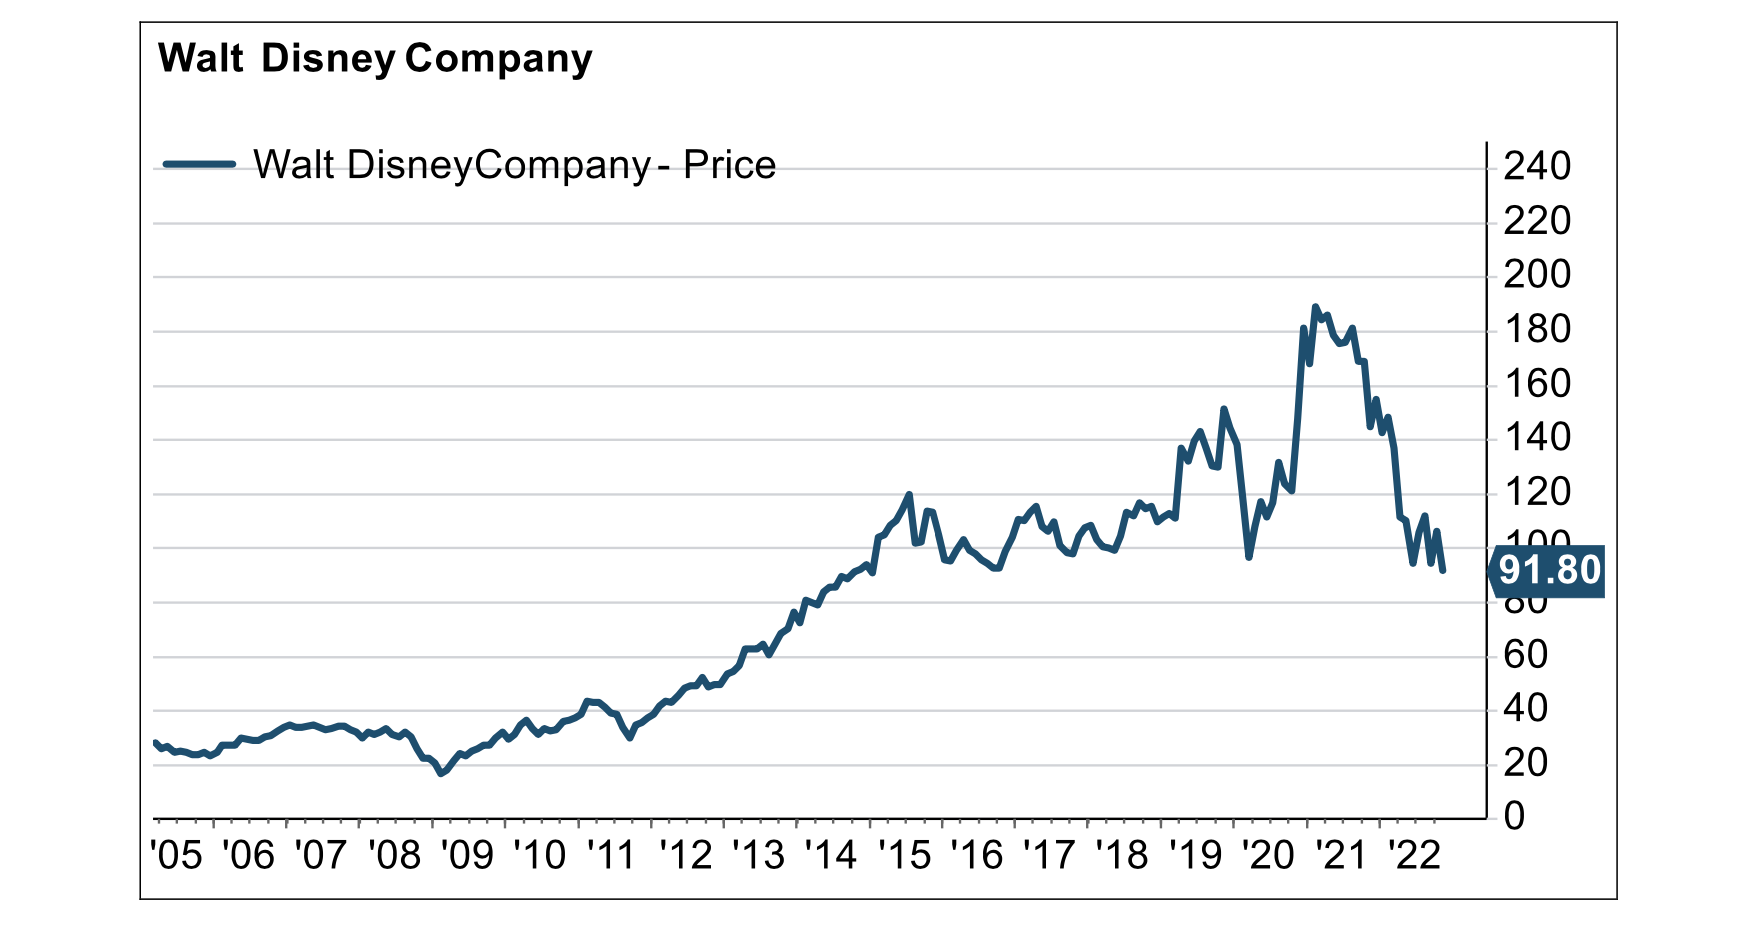
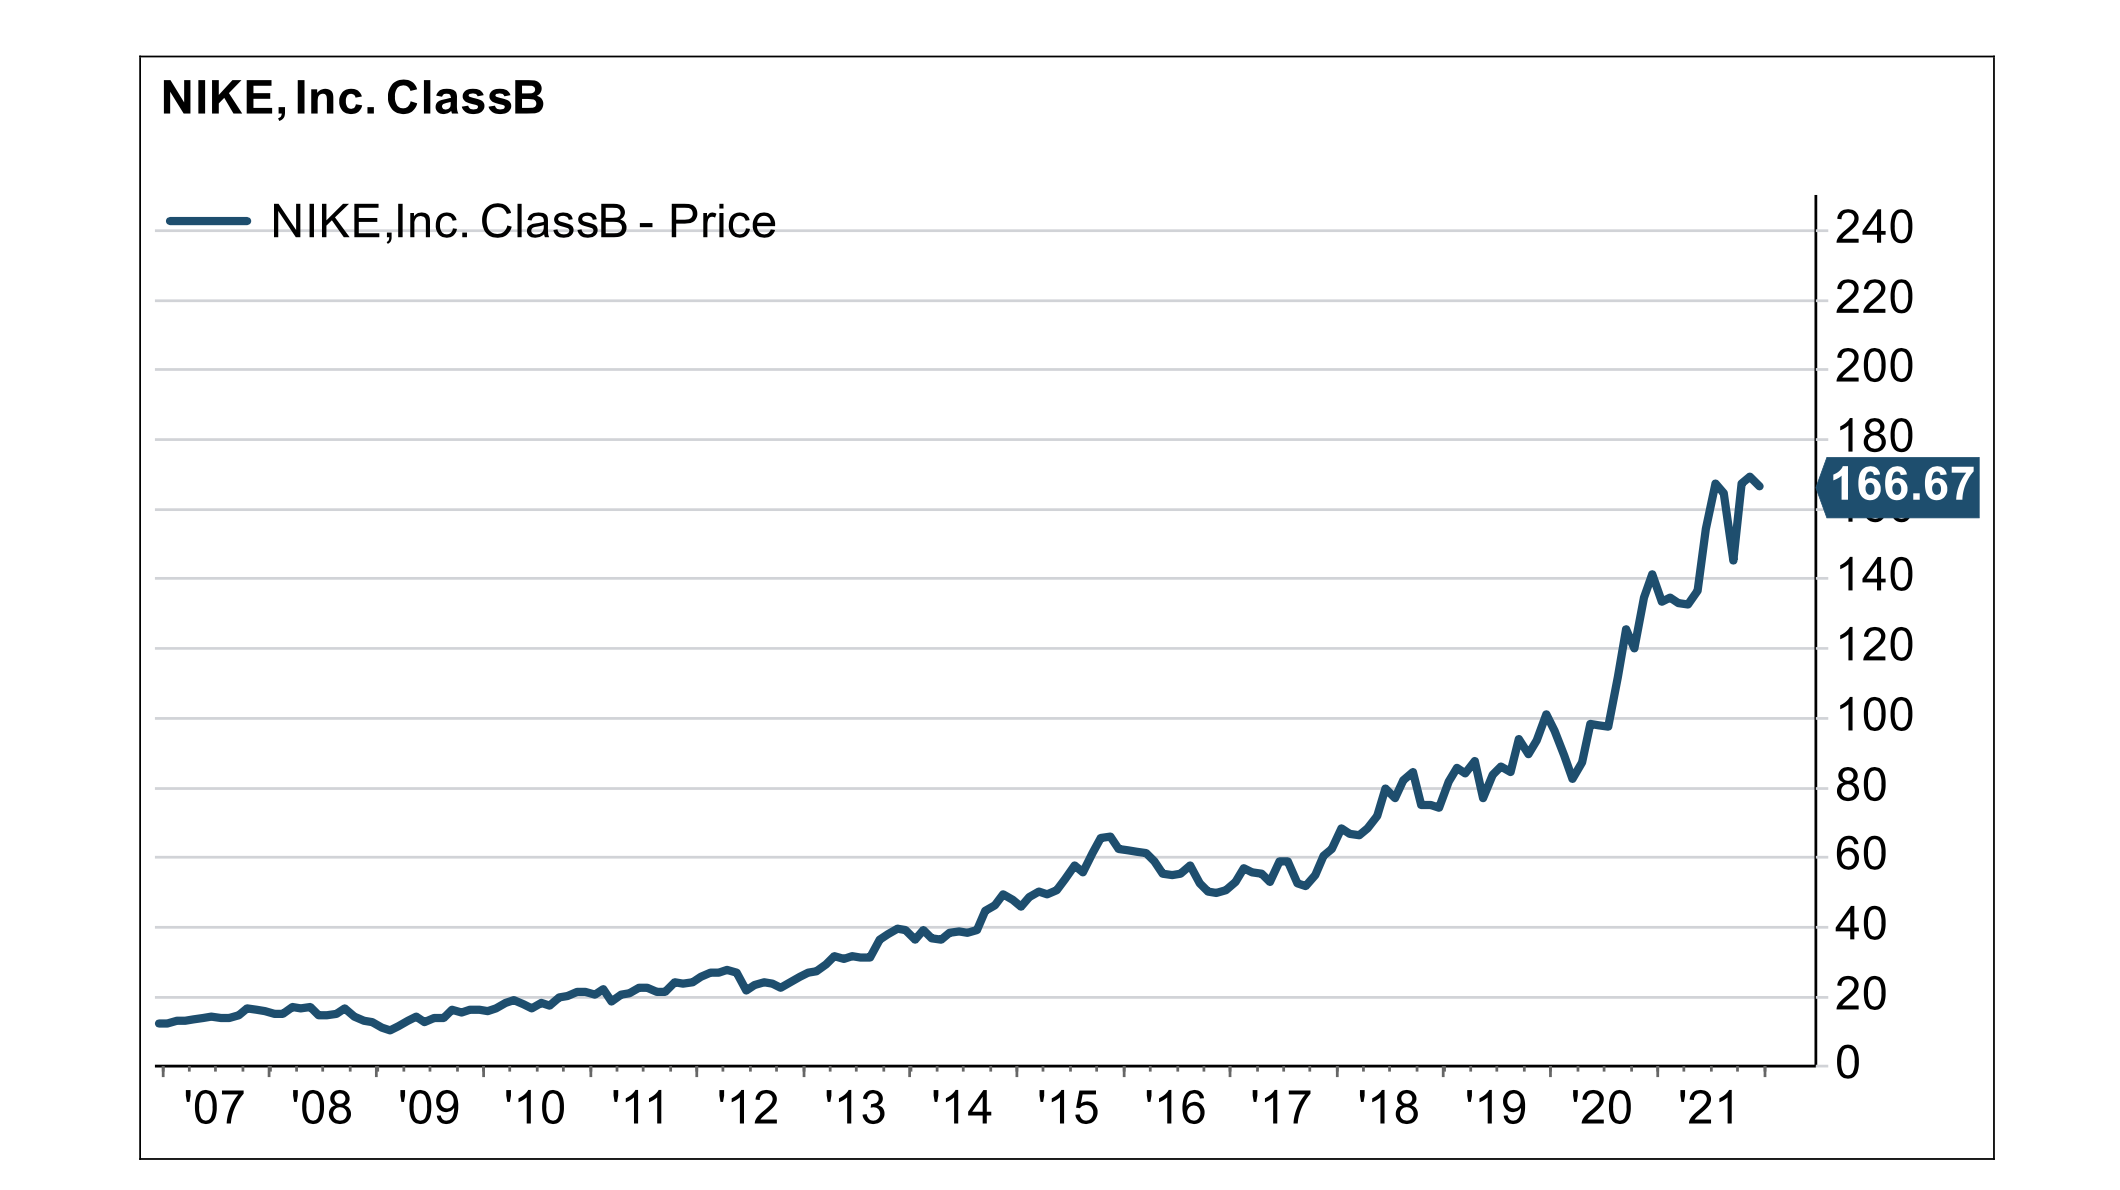
Individual securities offer powerful advantages for ultra-high-net-worth investors.

If you’ve been investing for a while, at some point you were probably told that mutual funds were not only an easy answer, but also a wise one, promising a strong return with minimal effort and monitoring. This advice is not wrong, but it doesn’t apply to everyone. 

After mutual funds rose to popularity in the bull market of the 1990s, they became a staple of individual retirement accounts (IRAs), which were rapidly replacing traditional pensions. IRAs and other mass-market purposes are exactly what mutual funds are designed for, and they typically perform well toward those goals. But they don’t make sense for investors with the resources to gauge the market on their own. 

“One of the things that differentiates Whittier Trust is our belief that clients should own individual positions versus mutual or co-mingled funds,” says David Ronco, Senior Portfolio Manager at Whittier. “Buying individual securities for our clients allows us to save them money with respect to fees and taxes while creating a customized, transparent investment solution.” 

“As a portfolio manager, I have an in-depth understanding of all major asset classes including equities, fixed income, real estate, and alternatives,” Ronco continues. “For each client’s portfolio, our team hand-picks the best individual investments to meet their goals.” 

Here, Ronco explains four key benefits of owning individual securities.

Customization

Mutual funds are designed to reach a broad cross-section of market participants. “The only customization they offer is a choice between general goals such as growth or income,” Ronco explains. “They don’t take into account your philosophy, your risk tolerance, or the many other factors that can make you a standout investor. They are truly the lowest common denominator of investing.”

Overall Cost

Many mutual funds have high expense ratios, layered on top of wealth management fees. “We call that fee layering, and it’s not an issue with individual securities, which have no embedded fees,” Ronco says. “So right off the bat, moving to individual securities significantly increases the compounding return potential of a client’s portfolio.” 

Tax Efficiency

“Individual securities are also more tax efficient than mutual funds by far,” says Ronco. “Mutual funds are essentially not concerned with tax efficiency. They generate capital gains and losses as they trade securities throughout the year, and they have to distribute those net capital gains evenly to all shareholders, even those investors that didn’t engage in any buying or selling.”

Whittier clients benefit from direct ownership of their holdings, which allows precise control over capital gains enabling flexible tax loss harvesting and tax-free compounding. Our portfolio managers strategically leverage these advantages through constant analysis of client positions, ensuring proactive, year-round tax optimization, not just a reactive approach at tax time.

Transparency

Individual securities offer Whittier clients ultimate transparency so their stakes in specific industries and companies are completely clear. “We can provide detailed, real-time information about every security our clients hold,” explains Ronco. “Mutual funds, on the other hand, are a bit of a black box, often reporting 60 to 100 underlying positions under a single, vague name or symbol.”

Growing Your Portfolio

At Whittier, no two client portfolios are the same, and the individual securities selected by portfolio managers and the Whittier investment team reflect the understanding we have of each client’s assets and goals, built through long-term relationships.

“We help families preserve and grow the wealth that they have worked hard to create,” Ronco says. “I consider it a privilege to share the expertise of our Whittier team and my own in-depth understanding of all asset classes—including equities, fixed income, real estate, and alternatives—to help clients build wealth.”


If you’re ready to explore how Whittier Trust’s tailored investment strategies can work for you, start a conversation with a Whittier Trust advisor today by visiting our contact page.


From Investments to Family Office to Trustee Services and more, we are your single-source solution.

An image of a silver and gold ring intertwined together.

A calculated approach to risk management allows investment objectives to be met regardless of the conditions.

Managing risk is one of the most important portfolio management objectives. Risk is simply the possibility that an outcome will differ from what is expected or hoped for.

“Investment risk is like the wind on top of a mountain,” says Caleb Silsby, chief portfolio manager at Whittier Trust Company. “It’s unpredictable and often cannot be seen or even anticipated. The more calm the environment is around you, the less prepared you are likely to be when it hits.”

But with the right guidance and preparation, risk can be managed and planned for in a way that allows investment objectives to be met regardless of the conditions—to be understood rather than feared.

Whittier Trust offers a calculated approach to risk management that has served clients well through many market cycles. “We emphasize three interconnected mechanisms,” Silsby says, “And this trifecta has proven time and time again to generate strong returns for our clients.”

Recognizing the Risk Continuum

Most clients want more return than the bond market but less risk than the stock market. To achieve this outcome, Whittier Trust starts with an investment philosophy centered around owning quality companies. “With high-quality companies, you can own more of a higher returning asset class in your portfolio than you would with riskier, lower quality equities,” explains Silsby. “Whittier’s research team analyzes the history, management, and financials of these companies. When we refer to a stock as high-quality, it means the company has a clean balance sheet, strong management team, lasting competitive advantage, and strong returns on capital deployed.”

Minding the Bear

Correlation is a statistical tool for portfolio managers that indicates the degree to which securities move in relation to one another. Whittier Trust believes that in bear markets, correlations move to one (a perfect positive correlation), and the dollar tends to strengthen. “We are also mindful of currency impacts that often catch unwitting investors by surprise during bear markets,” says Silsby.

Whittier Trust has managed money through multiple market cycles and has seen the commonalities of bear markets. We employ thoughtful portfolio construction that anticipates a risk-off environment where risk assets will tend to move in synchrony. We set up portfolios with the anticipated market shifts in mind, which allows us to plan for the unexpected. During the 2022 bear market, the Whittier investment team anticipated the Federal Reserve’s aggressive interest rate hikes in response to inflation and maintained a constructive outlook despite widespread concerns and panic about a deep recession. Our disciplined approach emphasized a balanced perspective, suggesting that fears of stubborn inflation and severe economic downturns might be overstated. In 2023, amidst significant challenges such as regional bank collapses, Whittier Trust assessed the broader financial system’s resilience, predicting these crises would be “bumps in the road” rather than catastrophic events. This perspective proved revelatory, as markets rebounded, with the S&P 500 delivering a 26.3 percent total return for 2023. By aligning their investment strategies with key economic indicators and maintaining a steady hand, we have reinforced our reputation as a reliable partner in wealth management during challenging market cycles.

Playing the Long Game

Whittier’s formula for managing risk is focused on long-term investments. The market generates returns much more often than it doesn’t, making long-term investments one of the best ways to grow wealth. Silsby advises: “If you can be a long-term, patient investor who avoids being a forced seller, then the true risk to manage around is permanent loss of capital. Such losses most commonly arise through forced selling, uncontrolled equity dilution, or too much leverage.” Forward-thinking investors can ride out market volatility and take advantage of compounding returns, dividend growth, and capital appreciation.

As the oldest multifamily office headquartered on the West Coast, Whittier Trust Company has refined our approach to managing both short- and long-term risks over nearly four decades. As in everything we do, our guiding purpose as fiduciaries is to understand and meet clients’ overall goals and best interests, while working to ensure the resilience of their portfolios. With the long-term in mind, we can help protect clients, their families, and their legacies through uncertain economic trends and market fluctuations with tailored investment plans and our exceptional commitment to personal service.

To learn more about how Whittier Trust has approached portfolio management and managing risk for over thirty years as a multi-family office, start a conversation with a Whittier Trust advisor today by visiting our website.


To learn more about how Whittier Trust's calculated approach to risk can make a difference for your investment portfolio, start a conversation with a Whittier Trust advisor today by visiting our contact page.

From Investments to Family Office to Trustee Services and more, we are your single-source solution.

An image of a silver and gold ring intertwined together.

Whittier Trust’s internal investment team selectively partners with outside managers to yield higher returns. We call it our hybrid architecture. Our clients call it the best of both worlds.

Internal + External Investing

The investments we make on behalf of our clients fall into two categories: those our internal investment team manages directly and those we allocate to outside managers. Most investment managers employ only one of these strategies, which makes our dual approach relatively uncommon—enough so that we gave it our own name: hybrid architecture. 

Equities, fixed income, and real estate are the three major asset classes directly managed by Whittier Trust’s investment team. For one other major asset class—alternatives—we allocate to external managers. The alternatives asset class includes private equity, venture capital, private debt, and hedge funds. 

“We know that this internal-external distinction can seem abstract,” says Sam Kendrick, Whittier Vice President and Portfolio Manager, “But it perfectly embodies Whittier’s unique history and client-centric approach. We’ve been in the multi-family-office business since 1989, and we’ve continuously evolved our structure to find the approach that gets the best result for our clients. We used to outsource the management of stocks and bonds—stocks to mutual funds, and bonds to brokers. But after years of analysis, we felt confident we could beat Wall Street’s returns, especially on an after-tax basis. We moved the management of stocks and bonds in-house. Since doing that, we haven’t looked back.”

Custom Solutions for UHNWI Clients

One of the primary reasons outsourcing equity management can lead to worse results is that it limits the ability to customize investment exposure around clients’ unique needs. 

The investment products that Wall Street creates don’t cater to Whittier’s particular clients, who are interested in returns after taxes. “Wall Street products pursue the highest headline return possible to gather assets while ignoring the tax consequences,” Kendrick says. “This is because only a quarter of the U.S. stock market is owned by taxable investors. Unfortunately, the result is excessive turnover and capital gains, leading to lower after-tax returns.”

What’s more, in an equity mutual fund structure, investors have no control over the timing of gains. Capital gains are realized and distributed at the whim of other investors in the fund. This is unacceptable for most Whittier clients, who tend to have vastly different taxable incomes each year due to liquidity events and private investments. By investing in individual stocks for clients, rather than equity funds, we’re able to create dispersion: A few stocks will go up many multiples of the original investment while others go down. This allows us to sell losing stocks to offset gains while winning stocks can be donated to avoid capital gains entirely, all of which leads to an increase in after-tax returns.

Whether it’s low-basis, legacy stocks, or ownership interests in private businesses, many of our clients have meaningful existing exposures in specific companies and industries. Buying an equity mutual fund or ETF will indiscriminately add to existing concentrations, needlessly increasing risk. Actively managing portfolios of individual stocks allows us to strategize exposure to best suit each client’’ specific balance sheet. 

Maximum Return on Fixed-Income Investments

The way the Whittier Trust team manages fixed income internally comes from knowing the goals of our clients and working backward. “Our clients want the maximum return from fixed income with minimal risk,” says Kendrick. “They don’t specifically want to own munis, treasuries, or preferreds.” While most funds only buy one type of bond, regardless of the relative attractiveness to other types, our team looks for bonds that deliver the best returns for each client with their specific tax situation in mind. We analyze opportunities outside municipal bonds, factoring in the added tax to make apples-to-apples comparisons, and then choose the best investments. The result is a portfolio that’s not only higher returning but also more diversified. 

Deep Experience with Real Estate

Whittier has been actively investing in real estate since our origin as a single-family office more than a century ago, and we use that expertise to buy individual buildings that our clients own directly. With ownership limited to Whittier clients, we have the control to build real estate portfolios on a deal-by-deal basis, diversifying by property type and geography according to clients’ needs. And because there is no fund structure and no outside investors, we decide when to sell based only on when is best for our clients. 

Partnering on Alternative Investments

With Whittier’s successful record managing investments internally, the obvious question is why wouldn’t we keep everything in-house? Why allocate to outside managers for alternative investments? “The reason comes from our client-focused approach,” Kendrick explains. “Throughout our history, we’ve managed alternative investments in both ways, internally and externally, and the results for our clients have been better using external managers.”

Whittier’s scale allows us to meet with hundreds of outside managers a year—spanning hedge funds, private equity, and private debt—and select the best ones for our clients. These high-quality managers, selected from the most attractive alternative investment sub-asset classes, offer an impressive array of opportunities for diversification and above-market returns. Allocating to outside managers means we can be both broad and nimble in an asset class that is evolving and expanding, rather than internally managing alternatives, thereby restricting ourselves to only a handful of strategies and sub-asset classes. And because we don’t charge additional fees on alternatives, we continue to ensure that our incentives are aligned with our clients’. 

It's the best of both worlds: With Whittier Trust’s hybrid architecture, clients get customized, direct exposure to stocks, bonds, and real estate, as well as access to the best private equity, private debt, and hedge fund managers with no extra charges. It’s a structure that has evolved organically over time to best serve our clients’ needs. “You reap higher returns because we can minimize taxes and eliminate layers of investment products and embedded costs,” Kendrick says. “Our clients get the kind of results you’d expect from the single-family office model of direct ownership, but with the scale advantages of a multi-family office. And as we continue to grow and learn about our clients, we’re always looking for new solutions that will further their goals.”


For more information about how a hybrid team of internal professionals and the right external experts can help your investment portfolio, start a conversation with a Whittier Trust advisor today by visiting our contact page.


From Investments to Family Office to Trustee Services and more, we are your single-source solution.

An image of a silver and gold ring intertwined together.

Shifting Gears In The Economic Cycle

The U.S. economy has now remained resilient to the massive post-pandemic inflation shock for well over two years. As a result, the economic outlook has changed dramatically from the inflation peak in June 2022. We trace this progression to assess where we stand now and what lies ahead.

The longest economic expansion on record from 2009 to 2020 established a new, lower trend-line real GDP growth rate of just below 2% for the U.S. economy. Against this benchmark, investor expectations have shifted sequentially through the following four phases of real GDP growth from 2022 onwards.

  • Inevitable recession - Negative growth, well below 0%
  • Soft landing - Below-trend growth, above 0% but below 2%
  • No landing - Trend growth, around 2%
  • “Launch” landing - Above-trend growth, above 2%

We describe the last scenario as a “launch” landing in our lexicon and believe the new post-pandemic economic cycle will normalize at real GDP growth above 2% in 2025 and beyond.

While this evolution of the economic outlook may have surprised many investors, it almost played out as we expected three years ago. We were firmly of the opinion that inflation would subside rapidly as pandemic-induced supply shortages resolved on their own. We believed the U.S. economy had become more insulated from interest rate increases as consumers and corporations locked in low, long-term, fixed rates for their loan obligations. We had all but ruled out a recession and believed that growth was likely to surprise to the upside.

The momentum of the economy in 2024 was strong enough to overcome the uncertainty of the U.S. elections. If anything, the unexpected GOP sweep in November raised hopes of an even stronger economy on the heels of continued fiscal stimulus and deregulation. Company profits in 2024 were almost in line with lofty forecasts and earnings growth expectations for both 2025 and 2026 are still high at 13-15%.

It is no surprise then that the U.S. stock market delivered strong performance yet again in 2024. The S&P 500 index rose by 25.0%; the Nasdaq index, which includes the Magnificent 7 group of technology leaders, gained 29.6%; and the Russell 2000 index of small companies was up 11.5%. In fact, the S&P 500 index has now delivered the rare outcome of back-to-back total returns of at least 25% in two consecutive years.

The continued strength in the U.S. economy and stock market brought a lot of cheer to investors in 2024. However, it has now led to two major concerns in 2025.

Investors got clear evidence in July 2024 that the Fed could soon start cutting interest rates when headline CPI inflation registered its first post-pandemic monthly decline. From that point on, investors aggressively priced in multiple rate cuts under the benign scenario of continued disinflation and solid Goldilocks growth which was neither too hot nor too cold.

These expectations began to unravel towards the end of 2024. As investors began to price in a Trump win and then eventually saw the GOP sweep, interest rates began to rise in anticipation of a number of knock-on effects related to the election outcome.

a. Higher economic growth from continued fiscal stimulus, a new regime of deregulation and technology-led growth in productivity

b. Higher fiscal risks from larger fiscal deficits

c. Higher inflationary pressures from both higher growth and new policies on tariffs and immigration

At the same time, prospects of higher economic growth and higher corporate profits pushed stock prices and valuations higher.

In the last four months (from mid-September to the time of writing), interest rates have risen by more than 1%. Market expectations of Fed rate cuts have now declined to less than two; in fact, many are now assigning a non-zero probability to rate hikes in 2025. And in the stock market, strong returns have pushed valuations higher; the forward P/E for the S&P 500 stood at 21.5 at the end of December 2024.

These data points now pose the following risks to investors.

  1. Will interest rates stay high or go even higher? Will high(er) interest rates bring down the stock market and eventually stall the economy?
  2. Even if the stock market survives the burden of high interest rates, will it buckle under the weight of its own (high) valuations?

We address these two key questions on the way to developing our 2025 economic and market outlook.

Interest Rates

The recent low in the 10-year Treasury bond yield was 3.6% on September 16, 2024. After a strong jobs report on January 10, 2025, the 10-year Treasury yield almost reached 4.8%. This 1.2% increase is significant because it is unusual for long-term rates to move higher after the onset of a Fed easing cycle.

We see this historical anomaly more clearly in Figure 1.

Figure 1: 10-Year Treasury Yield Before and After First Fed Cut

Source: FactSet; Average includes rate cuts from June 1989, September 1998, January 2001, September 2007 and July 2019; as of January 10, 2025

Long-term interest rates normally decline when the Fed starts cutting rates. The simultaneous decline in both short-term and long-term interest rates is intuitive. Fed rate hikes usually slow the economy down to the point where rate cuts become necessary to prop it up. Fed rate cuts normally coincide with economic weakness and, therefore, a decline in long-term rates.

The divergent trend in Figure 1 is another reminder about the inefficacy of monetary policy in this economic cycle. At the outset, post-pandemic inflation was more attributable to supply side disruptions and fiscal stimulus than it was to monetary stimulus. Then, Fed rate hikes and higher interest rates didn’t cause the type of demand destruction that one would have normally expected. And now, expectations of higher growth are being driven by factors other than monetary policy.

We make an argument in the following sections that we are shifting to a higher gear of growth in this economic cycle. We observe in passing that the drivers of economic growth are also shifting. We believe the baton for higher future growth has now been handed off from monetary policy to higher productivity growth, deregulation and fiscal stimulus.

The first stage of our interest rates analysis is to understand why they are going up.

Nominal interest rates are comprised of two components: 1) inflation expectations and 2) real interest rates. We look at each of these factors separately.

Inflation Expectations

Under normal conditions, the 10-year Treasury yield will generally exceed inflation expectations for the next 10 years. Longer term policies drive these inflation expectations more than shorter term trends. In the current setting, inflation fears have been elevated by prospects of higher growth, immigration policies that may reduce the supply of workers and the implementation of proposed tariffs.

We do not believe that 10-year inflation expectations have changed materially in the last few months. For a while now, we have thought the Fed’s 2% inflation target was likely to be elusive. Our fair estimate of 10-year inflation expectations is slightly higher at around 2.25%.

We believe the market is mispricing a higher level of expected long-term inflation. We support our more benign view on inflation with the following observations.

i. We know high universal tariffs can be inflationary and harmful to domestic growth. We don’t believe they will be implemented as originally proposed; they will ultimately be selective, targeted and reciprocal. We believe the threat of tariffs is likely a negotiating tactic; it is aimed more at opening up foreign markets than at sourcing revenue. The bark of expected tariffs will probably end up being a lot worse than its actual bite.

We believe that the impact of immigration policy on the economy will also be less severe than anticipated.

ii. Inflation has been trending higher in recent months. We believe there may be some unusual base effects at play in these short-term trends. CPI prices fell in the fourth quarter of 2023, then rose sharply in the first quarter of 2024 and have been fairly steady thereafter. As a result, year-over-year changes in CPI inflation may come down in the coming months.

In any case, these recent trends are unlikely to materially affect inflation over the next 10 years. Counter to growing investor concerns, expectations for 5-year inflation, starting in 5 years from now, have remained well-anchored at about 2.3% even as long rates have gyrated violently.

iii. And finally, we maintain our high conviction that technology will continue to create secular disinflation in the coming years. We are hard pressed to think of enough inflationary tailwinds to overcome this one powerful disinflationary force.

We next look at the other potential drivers of the increase in long-term interest rates.

Real Interest Rates

Real interest rates are primarily influenced by long-term changes in the level of economic activity. Increases in economic growth rates cause the real interest rate (and, therefore, the nominal rate as well) to increase and vice versa. In fact, one of the more useful heuristics in the capital markets is that long-term nominal interest rates are typically bounded by the long-term nominal GDP growth rate expectations.

For the sake of completeness in our analysis, we make a small detour here to resolve one other nuanced driver of changes in real interest rates — changes in the risk premium. If investors perceive fiscal risks to be higher, they will in turn demand a greater compensation for bearing that risk through higher interest rates.

There is a great deal of angst that the incoming administration will continue to increase government spending and the fiscal deficit. We tackled this concern about greater fiscal risks comprehensively in our 2024 Fourth Quarter Market Insights publication.

For a myriad of reasons, we concluded that fiscal risks are not as elevated as feared and unlikely to trigger higher inflation or higher interest rates. We believe that any pricing of a higher risk premium into higher nominal yields today is unwarranted.

We resume our focus on the topic of economic growth.

In a material shift in our thinking, we now see the U.S. economy shifting to a higher growth gear in the next decade. In the pre-Covid economic cycle, real GDP growth in the U.S. averaged an anemic sub-2%. We expect real GDP growth will now exceed 2.5% over the next 2-3 years and conservatively average 2.25% over the next decade.

These forecasts imply an upward shift of at least 0.5% in real GDP growth from the prior cycle. At first glance, this may seem overly optimistic because of the obvious headwind of an ageing population.

We know the natural or potential growth rate of an economy has two basic components: 1) growth in the labor force and 2) productivity gains of existing workers. We concede that unfavorable demographics and potentially adverse immigration policies will likely reduce the size of the future labor force.

This places the onus for higher GDP growth squarely on the second factor of increased productivity. In fact, with flat to negative growth in the labor force, productivity will need to increase by 0.5-1.0% to boost GDP growth rates by 0.5% or more. How feasible is this outcome and why?

We make the following arguments numerically and fundamentally to support the feasibility of such an outcome. We begin with a look at trends in productivity growth going back about 75 years in Figure 2.

Figure 2: Productivity Changes in the Non-Farm Business Sector

Source: U.S. Bureau of Labor Statistics; as of December 2024

The light blue bar in Figure 2 shows the average annual productivity growth rate in the last 75 years is 2.1%. However, productivity growth does fluctuate a lot around this long-term average. As a rule of thumb, it declines during recessions and periods of slow growth (1970s and the Global Financial Crisis – GFC) and rises during periods of growth and innovation (1980s and 1990s).

We can also see that big swings in productivity growth rates of +/-1% are feasible. Productivity growth rose by more than 1% during the era of Internet Innovations and fell by more than 1% post-GFC.

We believe the new post-Covid economic cycle will foster both innovation and growth for a number of reasons. Technology was deployed at a rapid pace during the pandemic with a positive impact on business operations e.g. hybrid work arrangements, automation and robotics.

Recent advances in AI have also set the stage for significant productivity gains in the coming years. Investments in AI so far have focused on the “infrastructure” phase to facilitate training, learning and inference. We are now moving into the “application” phase where AI systems and agents will monetize this infrastructure to create practical solutions and economic value across the enterprise.

Finally, stimulative deregulation policies from the new administration will also streamline business processes and unlock operational efficiencies. The trifecta of technology, AI and deregulation can easily unlock an increase in productivity growth of approximately 1%.

Our forecast for the real interest rate over the next 10 years is 2.25%, in line with our real GDP growth estimate.

We now have forecasts for both inflation expectations and the real interest rate. Coincidentally, they are both around 2.25%. Our fair estimate for the 10-year Treasury yield is simply the sum of these two components.

We expect the 10-year Treasury yield will settle in the 4.5-4.6% range by the end of 2025. We don’t expect it to go much higher than the 4.8% level of January 10; it will instead recede by a small margin.

We are clear that an increase in real rates is a bigger factor in driving interest rates higher than a change in inflation expectations. We do not believe that inflation is headed higher; it will instead move lower in a bumpy manner. Based on our inflation outlook, the Fed will have more room to cut rates in 2025.

Higher real rates signal a stronger, healthier economy. Stronger economic growth bodes well for corporate profits. We believe that our inflation forecast of 2.25% and 10-year Treasury yield forecast of 4.5% will still be supportive of stock prices.

We close out our analysis and outlook for 2025 with a look at stock market fundamentals.

Stock Market Valuations

U.S. stocks have performed well in the last two years. While their returns have been naturally rewarding, those same high returns have also created risks going into 2025.

On the heels of two consecutive years of at least 25% total returns, U.S. stocks now appear expensive. Many valuation metrics are in the highest quintile of their historical ranges. We take a closer look at a couple of these valuation measures.

At the outset, we acknowledge the topic is complicated and nuanced. Our research is always deep, thorough and rigorous. However, our insights here are curtailed by the finite scope of this article.

We are mindful that the four most dangerous words in investing are widely believed to be “this time is different.” And yet, we also know that a number of time-tested paradigms haven’t worked in the post-pandemic economy and markets. The absence of a recession so far on the heels of an inverted yield curve even after a long lag of two years is a case in point.

We do our best to straddle this balance between respecting historical norms and yet thinking creatively and fundamentally about what might indeed be different this time around.

A commonly used valuation indicator was originally identified by Warren Buffett in a 2001 Fortune magazine essay. The Buffett Indicator measures the market value of all publicly traded U.S. stocks as a percentage of U.S. GDP. When the metric is high, stocks are vulnerable to a sell-off.

The Buffett Indicator has attracted significant attention in recent weeks as it went surging past a level of 200%. In other words, the market capitalization of all U.S. stocks is now more than double the level of total U.S. GDP. The Buffett Indicator suggests that U.S. stocks are now significantly over-valued.

We respect the broad message here that U.S. stocks are not cheap. However, we believe that a couple of relevant insights provide a more balanced perspective on this valuation metric.

The Buffett Indicator is anchored only to U.S. GDP in its denominator. However, many U.S. companies compete effectively in foreign markets. Since a growing number of U.S. companies are multi-national, a material and increasing portion of S&P 500 earnings is generated overseas. Clearly, the market value of all U.S. stocks in the numerator is not bounded by just the size of the U.S. economy. This mismatch causes the Buffett Indicator to rise steadily over time.

We look at another fundamental difference over time that may more rationally explain the trend in the Buffett Indicator.

We know stock prices follow corporate profits; as go profits, so do stock prices. Much like the construct of the Buffett Indicator, we track U.S. corporate profits as a percentage of GDP in Figure 3.

Figure 3: U.S. Corporate Profits as a Percent of GDP

Source: U.S. Bureau of Economic Analysis; as of Q3 2024

U.S. companies have continued to become more and more profitable. Almost analogous to the doubling of the market value of all U.S. stocks as a percent of GDP, U.S. corporate profits as a percent of GDP have also nearly doubled from 6.0% to 11.3%.

We believe these fundamental connections between the growth of U.S. corporate profits and the rise in U.S. stock values help us better understand and interpret the Buffett Indicator.

In a similar vein, the Forward P/E (“FPE”) multiple has attracted a lot of attention in recent months. At 21.5 as of December 2024, it is also in the highest quintile of its historical range.

There are two concerns related to the FPE ratio. One, it relies on future earnings (“E”) that were already deemed lofty before the rise in interest rates. And two, even if E comes through as expected, the FPE ratio itself is at risk of compressing through a decline in prices (“P”). We address each of these risks separately.

We have already made our case for a higher gear of growth in the preceding sections. The sustainable spurt higher in real GDP growth from a revival of productivity growth should also spill over into earnings growth.

Consensus analyst forecasts call for an earnings growth rate of 14.8% in 2025 and 13.5% in 2026. We believe these growth rates can be achieved; there is still room for profit margins to expand and augment higher economic, productivity and revenue growth.

We are in general agreement with the market that the P/E ratio will decline in the coming months. We also know that higher starting valuations lead to lower future returns. We are clear that stock returns going forward will be more muted than those seen in recent years.

However, we disagree with the market on both the likely magnitude and speed of decline in the P/E ratio. Investors worry that the 2024 FPE multiple of 21.5 could slide all the way down to its long-term average of around 16. They also fear that the resulting bear market could unfold quickly over just a few months.

We believe that the compression of the FPE multiple will be neither so drastic nor so abrupt. U.S. companies are now more profitable than they have ever been; aggregate free cash flow margins exceed 10% and return on equity is almost 20%.

On the heels of secular innovation, growth and profitability, we believe the fair value of the S&P 500 FPE multiple is now higher at 18-19. We also believe that any decline in the FPE from 21.5 to 18-19 will be more gradual. We expect positive earnings growth to offset the more orderly compression of the FPE multiple.

We illustrate the difference in our stock market forecast and the market consensus in Figure 4.

Figure 4: S&P 500 Forward P/E Ratios and Subsequent 10-Year Returns

Source: Bloomberg; from 1988 onwards; as of December 2024

Figure 4 shows the historical association between the FPE ratio and subsequent 10-year returns from 1988 onwards. A quick visual inspection validates our intuition. Higher initial valuations do lead to lower future returns.

The historical data is heavily influenced by two mega crises that took place just a few years apart – the Bursting of the Internet Bubble (BIB) in 2000-2002 and the GFC in 2007 2009. In each instance, earnings declined significantly as did stock prices and valuations.

The empirical relationship in Figure 4 suggests that the current FPE ratio of 21.5 (shown by the grey vertical bar) may lead to stock returns as meager as 2-3% annualized over the next 10 years. A key assumption in this projection is that both earnings (E) and valuations (FPE) will fall as dramatically as they did in the BIB and the GFC.

Our fundamental analysis does not reveal significant downside in E or the FPE multiple. Our earnings outlook identifies more positive fundamentals (e.g. growth in profit margins and productivity) than negative ones (e.g. excessive leverage). We also believe that the fair value of the S&P 500 FPE ratio is now fundamentally higher than it was in prior decades.

We, therefore, expect a higher stock market return over the next 10 years in the range of 8-10% shown by the red bar in Figure 4. We believe that earnings growth of 8-10% and a dividend yield of 1-2% will offset valuation declines of 1-2% annually in the coming decade.

Our stock market outlook for 2025 is also optimistic. We believe expected earnings growth and the dividend yield will create a tailwind of almost 15%. Since interest rates have moved sharply in recent months, we realize the valuation compression in the near term may be as large as -5%. We aggregate these drivers to forecast a 10% total return for the S&P 500. We expect the S&P 500 to reach a level of 6,400 by the end of 2025.

We conclude with a summary of our outlook for the economy, inflation, interest rates and the stock market.

Summary

The economic and market outlook is becoming less dispersed and more homogenous across investors. As an example, there are virtually no proponents of a recession today. It is harder to offer too many differentiated views against such a backdrop.
We summarize the key tenets of our outlook here.

Economy

  • We expect real GDP growth of 2.5% or above in the next 2-3 years in a significantly pro-growth regime.
  • Real GDP growth will normalize at a level of around 2.25% over the next 10 years.
  • We see a clear shift in the drivers and gears of economic growth. The impetus for higher growth in this cycle will come from deregulation, fiscal stimulus and an increase in productivity growth of 0.5-1.0%.

Inflation

  • We do not see an inflection in inflation up to higher levels.
  • Inflation should subside in a bumpy path to the 2.3-2.4% level by the end of 2025.
  • We believe the fair value for inflation expectations over the next 10 years is 2.25%.
  • We believe the market is mispricing a higher level of future inflation.
    • The impact of tariffs and immigration will be more muted.
    • Meaningful base effects will pull inflation lower in the second half of 2025.
    • Technology will continue to be a powerful secular disinflationary force.

Interest Rates

  • We estimate the real interest rate to be around 2.25% over the next 10 years.
  • We believe the fair value for the 10-year Treasury yield is 4.5-4.6%.
  • The bond market is overestimating the risk premium related to a perceived increase in fiscal risks.
  • Interest rates are likely to come down from their 4.8% level.
  • Based on our inflation outlook, the Fed will have more room to cut rates. We expect 3-4 rate cuts by the Fed in 2025.
  • A Fed policy misstep in the form of rate hikes or bond yields above 5% as a result of overzealous bond vigilantes could trigger a financial accident and curtail growth.

Stock Market

  • We believe that earnings growth and valuation fears in the stock market are overblown.
  • As a result, our expected returns for stocks are higher than consensus over both the 1-year and 10-year horizons.
  • We expect valuations to come down but not as dramatically or quickly as investors fear.
  • We believe earnings growth will match or exceed expectations in the near term.
  • We expect the S&P 500 to reach 6,400 by the end of 2025 and generate a 10% total return.
    • Earnings growth and dividend yield will create a nearly 15% tailwind for stocks in 2025.
    • Multiple compression of around -5% will detract from stock returns in 2025.
  • We expect U.S. stocks will generate annual returns of 8-10% over the next 10 years.
    • We reject the view that a severe valuation overhang will limit annual U.S. stock returns to 2-3% over the next 10 years.

We respect the difficulty of forecasting during normal times, and especially so in the midst of uncertainty. We will assimilate these views into our investment decisions with appropriate caution and adequate risk control.

We believe that 2025 will finally see a normalization of the U.S. economy after the recent pandemic and inflation shocks. We look forward to the prospects of investing in more normal markets.


To learn more about our views on the market or to speak with an advisor about our services, visit our Contact Page.

We expect real GDP growth of 2.5% or above in the next 2-3 years in a significantly pro-growth regime.


We believe the fair value for inflation expectations over the next 10 years is 2.25%.


We believe the fair value for the 10-year Treasury yield is 4.5-4.6%.


We expect U.S. stocks will generate annual returns of 8-10% over the next 10 years.

From Investments to Family Office to Trustee Services and more, we are your single-source solution.

An image of a silver and gold ring intertwined together.

The new year will present challenges and opportunities for ultra-high-net-worth individuals as they re-evaluate their portfolios and long-term financial plans in light of President-elect Donald Trump’s incoming administration. Strong partnerships between UHNW clients and their advisors will be essential during this transition and the ensuing four years. Proactive planning will be key, especially given potential shifts in tax laws, market dynamics and interest rates.

Tax Law

Before Trump’s election in November, many ultrawealthy families were scrambling to optimize their estate plans ahead of the scheduled sunset of the Tax Cut & Jobs Act to take full advantage of exemptions while they remained in place and to adjust estate plans when and if those exemptions reverted at the end of 2025.

The policy uncertainty in 2024 paved the path for families and their advisors to give more consideration to their legacy and how it will affect their extended family in the future. The impending tax law change forced conversations around important estate planning considerations such as dispositive provisions, age attainments, and wishes for the use of the hard-earned wealth for future generations. The difficult decisions around the mechanics of intergenerational wealth were front and center leading up to the election.

However, with the incoming administration, it’s likely that the TCJA will be extended or even made permanent. UHNWIs and their advisors should continue to review their estate plans and build on those important conversations despite having more time to approach their plans strategically.

This extended horizon also allows for a renewed focus on aligning investments and real estate strategies with enduring goals, emphasizing tax efficiency, diversification and legacy planning. Advisors should take this opportunity to evaluate the use of tax-advantaged structures, optimize trusts and consider philanthropic vehicles that can minimize tax burdens while fulfilling broader family objectives.

Market Dynamics

From deregulation to policy shifts on renewable energy sources to protectionist economic policies, Trump’s election will hold many implications for investors and their portfolios.

The stock market’s reaction to the election results was initially positive. The day after the election, 3 in 4 companies traded higher, with the three major indices reaching record highs. As investors digested the possible policy changes under the new administration, markets in November saw a strong post-election rally, led by small-cap stocks and supported by gains in large-cap indices. However, recent Federal Reserve interest rate cuts and signals of a cautious monetary policy approach for 2025 have sparked turbulence, with major indices like the Dow, S&P 500 and Nasdaq experiencing sharp declines in mid-December.

Projected winners are expected beneficiaries of deregulation including banks; energy-related companies (especially in the liquified natural gas space); cryptocurrencies, particularly bitcoin; technology companies facing increased anti-trust exposure; and Tesla with Elon Musk leading the newly formed Department of Government Efficiency, or DOGE, committee.

Projected losers are companies in the renewable energy space, including EVs not owned by Elon Musk and utilities invested in renewable energy sources. Other losers, given Trump’s protectionist platform, include international companies broadly, and China specifically.

It is still unclear how the markets will treat healthcare companies. Managed care organizations initially saw a bump in anticipation of a hoped-for easing in pricing scrutiny.  Since the election, MCOs have been selling off (CVS Health’s Stock has fallen 24% in December with UnitedHealth Group and Cigna Group also experiencing substantial declines), with the expectation that they may be more heavily scrutinized if Robert F. Kennedy Jr. is confirmed to head the Department of Health and Human Services. The industry-level volatility may create opportunities for investors with the ability to tolerate short-term pricing aberrations if the policies are more moderate than feared.

Seriously, Not Literally

As the markets react and overreact to policy decisions, we are reminded that the new administration should be taken "seriously" but not "literally." Advisors and clients should keep in mind that administrations rarely achieve everything they set out to do. The challenge will be to react to a broader understanding of what the administration intends to focus on rather than fearing the most radical proposal or enacted policy.

Regardless of what policy shifts come to pass, the time-honored values of successful planning remain the same: prioritizing long-term strategies, tax efficiency and high-quality companies. It’s important for the advisor to encourage clients to stay disciplined, avoid being too hasty to react, and emphasize strategic consistency within a portfolio.

Having said that, it’s also important to communicate often with clients about shifts and expected changes within market cycles, as there are opportunities to be seized within any market environment.


Caleb Silsby is the Executive Vice President, Chief Portfolio Officer at Whittier Trust, overseeing a team that collaboratively manages portfolios for high-net-worth clients, foundations, and endowments. He is credentialed as a CFA Charterholder and CFP professional.

Featured in Barron's. For more information about private market investments, start a conversation with a Whittier Trust advisor today by visiting our contact page.


From Investments to Family Office to Trustee Services and more, we are your single-source solution.

An image of a silver and gold ring intertwined together.

Investor interest in private markets has surged over the past decade. To understand why, it's essential to grasp what these investments entail and the factors driving their growth. Here, we offer insights into the complexities and benefits of private market investments and outline Whittier Trust's distinctive approach.

Demystifying Private Market Alternatives

Private market alternatives might sound exotic, but they're essentially the private counterpart to public markets. Publicly traded stocks represent ownership in public companies. Private equity is simply ownership of a private company. The key distinction between public and private markets is liquidity. Public shares can be easily bought and sold on exchanges, whereas private equity investments may be subject to transfer restrictions and may require specialized brokers to facilitate transactions.

The Appeal of Performance

So why is investor interest in private markets growing so rapidly? The answer lies in performance. A report by Hamilton Lane found that over the past 20 years, returns from private equity buyouts outperformed global equities on a public market equivalent basis. This trend extends to private credit, which has also delivered more income compared to the public leveraged loan market, particularly appealing during low-interest environments.

Expanded Opportunities and Diversification

Beyond performance, the expansion of investment opportunities is a significant driver of interest in private markets. The number of public companies in the U.S. has declined by 50% since 1996, while private equity firms now own more companies than those listed publicly. Globally, the number of private companies with revenues over $100 million is over eight times that of public companies. This shift provides a broader array of investment options and helps mitigate concentration risk in public markets, where the top 10 firms currently account for over 35% of the S&P 500’s value.

The Whittier Trust Approach

It’s important to note that private markets come with additional risks, costs, and complexities, notably illiquidity. At Whittier, we use private markets to complement our core internal strategies, enhancing returns, diversification, and cash yield. This hybrid approach combines top-tier internal investment management with best-in-class private market managers.

Quality and Alignment of Interests

Quality is a cornerstone of Whittier’s investment philosophy. We believe that quality in public markets, and private markets, and the managers we partner with, are key to compounding wealth. This focus on quality extends to the selection of private market opportunities and partners.

Crucially, Whittier's incentives are aligned with client interests. We are not compensated by private equity managers to raise capital, nor do we incentivize employees to direct client assets to private markets. This conflict-free approach ensures that decisions are made solely in the best interests of clients, avoiding the pitfalls of added fees, commissions, and feeder expenses that can erode returns and turn good investments into poor results.

Strategic Integration and Expertise

Whittier Trust integrates private market investments as part of a holistic, diversified portfolio strategy. We view private investments as an extension of public market opportunities. With companies staying private longer, substantial value creation occurs before potential public offerings. Investing in private entities like SpaceX, which remains private and valued at over $200 billion after 20 years, exemplifies the potential for significant returns.

Final Thoughts

Private market investments offer expanded opportunities and the potential for superior returns, but they come with added risks and complexities. Private investment should be considered when after-tax returns, risks, and correlation characteristics more than compensate for higher costs and lower liquidity.

With a focus on quality, a conflict-free approach, and a strategy that integrates private and public market opportunities, Whittier Trust positions itself as a trusted partner for ultra-high-net-worth investors navigating the private market landscape. Whether you are new to private markets or seeking to deepen investments, Whittier’s expertise and alignment with client interests ensure a thoughtful and strategic approach to wealth compounding.


Written by Eric Derrington, Senior Vice President and Senior Portfolio Manager at Whittier Trust. Eric is based out of the Pasadena Office.

Featured in Kiplinger. For more information about private market investments, start a conversation with a Whittier Trust advisor today by visiting our contact page.


From Investments to Family Office to Trustee Services and more, we are your single-source solution.

An image of a silver and gold ring intertwined together.

In September 2024 we saw a Fed interest rate cut of 0.5 percentage points and another rate cut of 0.25 in November. Now, as we start 2025, The Fed is considering additional rate cuts. For ultra-high-net-worth individuals (UHNWIs), shifts in interest rates carry significant implications for wealth management strategies. Lower interest rates—though more elevated than in prior cycles—can influence everything from investment decisions to long-term planning. To navigate this landscape effectively, Whittier Trust advises affluent families to check in with their advisors to assess risks, seize opportunities, and safeguard their legacies.

Here are five essential questions to guide those conversations:

1. How Should My Investment Strategy Adjust to Reflect Market Conditions?

Interest rate cuts tend to buoy stock valuations, often making equities a more attractive option than bonds in certain scenarios. However, the dynamics of today's market—where interest rates remain higher than historical lows—warrant a nuanced approach. UHNWIs should ask their advisors about the wisdom of rebalancing their portfolios to capitalize on sectors poised to benefit from economic growth spurred by rate cuts.

For example, technology and consumer discretionary sectors often thrive when borrowing becomes more affordable, stimulating corporate growth. Conversely, some traditionally defensive sectors may underperform. The goal is to ensure your portfolio is positioned to benefit from rate-driven shifts while maintaining the long-term diversification necessary to weather economic uncertainty.

2. What Role Should Bonds Play in My Portfolio Now?

While bond yields have been suppressed in recent years, even modest increases in yields can make fixed-income assets more attractive as part of a diversified portfolio. Families relying on predictable income streams should consider whether their bond allocations need adjustments to optimize for yield and risk.

Ask your advisor if now is the right time to reintroduce or increase exposure to investment-grade bonds, municipal bonds, or alternative fixed-income vehicles. The relationship between rising bond yields and overall portfolio performance should be carefully analyzed to avoid unintended risk.

3. Is My Portfolio Adequately Hedged Against Inflation?

Lower interest rates stemming from Fed rate cuts often coincide with muted inflation, which can diminish the urgency of inflation-hedging strategies. However, inflation trends are dynamic and UHNWIs must remain vigilant. Ask your advisor to review whether your current portfolio includes sufficient protection against potential inflationary pressures in the future.

Real assets, such as real estate and commodities, can serve as hedges while offering diversification benefits. Meanwhile, Treasury Inflation-Protected Securities (TIPS) may be less necessary in a low-inflation environment. An advisor's expertise can help you fine-tune the balance between inflation protection and growth-oriented investments.

4. Are There Opportunities for Alternative Investments in This Environment?

Lower interest rates often drive interest in alternative investments, which can offer uncorrelated returns and enhanced growth potential. Private equity, venture capital and real estate are often key areas of focus for UHNWIs seeking to diversify and capitalize on rate-driven opportunities.

A crucial question to ask your advisor is whether the timing aligns with your financial goals and risk tolerance. In a shifting rate environment, access to exclusive investment opportunities through private markets can complement traditional portfolios, particularly for families with multigenerational wealth aspirations, but it’s important to ensure this decision is right for you.

5. How Can We Leverage Lower Interest Rates for Long-Term Wealth Transfer?

An interest rate cut creates potential opportunities for intergenerational wealth planning. Lower rates can reduce the cost of intra-family loans, making it more affordable to transfer wealth in ways that minimize estate and gift tax exposure. Additionally, strategies like grantor-retained annuity trusts (GRATs) become particularly attractive in a lower-rate environment. 

Meet with your wealth management advisor to evaluate how the current rates align with your estate planning objectives. By employing rate-sensitive strategies effectively, families can amplify the impact of their wealth transfers while preserving their legacy.

Partnering for Strategic Decisions

Navigating this period of post-pandemic inflation, one currently defined by periodic Fed interest rate cuts requires strategic decision-making and close collaboration with your advisor. Every family’s financial situation is unique, and a tailored approach is essential.

The interplay between interest rate cuts, market trends, and long-term goals underscores the importance of regularly revisiting your financial and estate plans. These five questions provide a strong starting point for meaningful discussions with your advisor, helping you adapt to evolving market conditions while safeguarding your family’s future.

An experienced advisor not only understands the technical aspects of wealth management but also acknowledges the emotional considerations that come with stewarding significant assets. By focusing on both, UHNWIs can position themselves for success across generations, regardless of economic shifts. At Whittier Trust, we’re committed to helping you navigate these complexities with a customized, thoughtful approach that evolves alongside your goals.


For answers to these questions and more, start a conversation with a Whittier Trust advisor today by visiting our contact page. 

From Investments to Family Office to Trustee Services and more, we are your single-source solution.

An image of a silver and gold ring intertwined together.

Typically, in portfolio asset allocation, the concept of diversification is deemed beneficial to avoid stock-specific risk.  There have been many academic studies supporting this concept.  Although diversification makes sense from a “risk-return” perspective, to have robust performance and beat benchmarks consistently, investors should find stocks that they are willing to hold in a sufficient portfolio weight that will consistently outperform benchmarks.  With the S&P 500 averaging 8-10% annual returns, finding stocks that provide upside over the index is not an easy task.

Nevertheless, the one way we have found to accomplish this objective is to take positions in stocks that are disruptors - disrupting their industries or even creating new ones and fulfilling customer needs better than the competition.  This means companies that are innovating in such a unique way over the longer term that the competition just cannot keep up.  These companies rapidly gain market share from incumbents or even establish new end markets where there is little competition.   

The modern-day example of such disruption is Nvidia. Most know the semiconductor industry was dominated by Intel for the majority of the late 20th century and into the 21st.  Intel focused on central processing units (CPUs) that were the “brains” of personal computers, notebooks and servers.  Intel relied upon Moore’s law, created by former Intel CEO Gordon Moore, which involved the doubling of computing power every two years. This worked well as the personal computer (PC) proliferated in global society and, later, as internet usage grew.  Intel dominated its end markets and had few viable rivals.

But as Moore’s law reached its peak, Nvidia has taken the crown of the world’s largest semiconductor company by making its graphics unit processors (GPUs) more functional to manage the demands of artificial intelligence (AI).  Nvidia’s semiconductors can work together in an array to create massive computing power and exceed the limits under Moore’s law.  In addition, Nvidia management has indicated a doubling of computing power essentially annually with each generation of AI-based GPUs.  

Such innovation has led to massive revenue growth with FYQ12025 (April) sales growth of over 262% and adjusted earnings per share growth of over 573%.  Nvidia has been a clear disruptor in the semiconductor industry and remains at the forefront of AI innovation likely for many years in the future. 

This is akin to Apple Inc.’s performance under former CEO Steve Jobs.  On June 29th, 2007, Apple introduced the iPhone which clearly took the smartphone concept to a new level.  Apple sales growth and stock price appreciation have been phenomenal from that date forward with an annualized revenue run rate just for iPhones of almost $200 billion (as of June 30, 2024) and the stock up 6000% (60x return) since the introduction.

So, what are some common denominators to successfully invest in disruptive companies?

We focus on the following:

  • A Visionary CEO 
  • High Growth or Nascent Industry That Will Be Very Large
  • Company’s Approach to Industry is Disruptive to Incumbents
  • Advantage(s) Will Last for Long-Term – Creating a Moat
  • Growing Free Cash Flow & Improving ROIC

1. Strong CEO Who is A Visionary

A visionary CEO is one of the most important things to look for when investing in the stock of any company, no matter the sector.  There have been many instances where a visionary CEO was replaced by one who was not so prescient or insightful.  These instances have typically led to the failure of the stock. We can point to many examples, with one of the most recent being Disney.  CEO Bob Iger led Disney from March 2005 and retired at the end of 2021.  Disney’s board chose Bob Chapek as Iger’s successor.  The company went from a well-run entertainment conglomerate to one that had lost its competitive advantages in many end markets.  Disney stock declined about 40% in less than a year under Chapek. Luckily, Iger returned in November 2022 with Chapek’s inauspicious dismissal.

2. High Growth Industry

A strong company in a weak industry is usually a poor investment.  Rather, the “secret sauce” is to own a “strong company in a strong industry”.  This typically indicates a market share gainer with a large total addressable market (TAM).  Nike’s rise to become the premier athletic shoe supplier was based on taking market share in an industry with an exceptionally large TAM. The same has been true for other disruptors like Nvidia, Meta, Eli Lilly and other stock success stories.

3. Disruption of Incumbents

On the introduction of the iPhone in June 2007, cellphone market leaders included Nokia, Motorola, Samsung, and LG.  As discussed above, the iPhone was a giant leap forward in terms of both communication and computing.  Apple’s growth under both CEO Steve Jobs and Tim Cook has been astounding, allowing Apple stock to surpass $3 Trillion in market capitalization.  The first iPhone disrupted the cellphone market and created the world’s largest company by market capitalization.  An investment of $100,000 at the introduction would be worth almost $5,800,000 today!  There are many other examples of such industry disruption from Netflix for consumer entertainment to Chipotle for burritos.

4. Advantage(s) Will Last for Long-Term – A Moat

Any investment that does not offer a long-term advantage is arguably a trade.  Trades are attractive to many investors but will not typically provide outsized gains, especially after short-term capital gains taxes are paid.  Companies that are disrupting need a large “moat” to make sure their competitive advantages remain intact over the long term to generate outsized stock returns.  This can be through patents and licensing (although enforcement internationally has been difficult), a superior customer interface or proprietary software (such as iOS for Apple or Cuda for Nvidia), or other means.  Nvidia’s annual product cycles which entail massive improvements in performance and efficiency for AI systems (as seen with the transition from the Hopper generation of GPUs to Blackwell late in 2024 and with Rubin planned in 2025) are the latest method demonstrated to maintain a long-term technological lead over competitors.

5. Growing free cash flow & Improving ROIC

Ultimately, companies that are disrupting their industries should show extraordinary improvement in their financial metrics i.e. they need to generate outsized returns for investors.  Some metrics to judge success are growth in free cash flows and return on invested capital (ROIC).  These metrics allow an investor to monitor company progress in an impartial fashion.  Improvement in both metrics over time should result from a successful industry disruption. Improvements in net margin also should be tracked.

Conclusion

Companies that are disrupting their industries have the possibility of adding outsized equity performance in a diversified equity portfolio.  There are many historical examples including Apple, Starbucks, Nvidia, Nike, Netflix and others whose CEOs and/or founders out-innovated and tactically outperformed peers to either create massive new markets or garner massive shifts in existing market share.  Undoubtedly, there will be new examples in the future.  Finding such companies early in their growth cycles is a key to future investment success.


To learn more about Whittier Trust's market insights, investment services and portfolio philosophies, start a conversation with a Whittier Trust advisor today by visiting our contact page.


From Investments to Family Office to Trustee Services and more, we are your single-source solution.

An image of a silver and gold ring intertwined together.

How Heavy is the U.S. Debt Burden?

The last several months have seen a steady drumbeat of data to validate both declining inflation and a slowing economy. CPI inflation for June posted a significant milestone with its first negative monthly print since the depths of the pandemic in Q2 2020.

The remarkable deceleration of inflation in the last two years has allowed the Fed to shift focus within its dual mandate. With inflation on track towards the Fed’s 2% target, the Fed has now started an easing cycle to address and halt continued economic weakness.

Even as lower inflation and the onset of monetary easing now become tailwinds for the economy, a number of market headwinds still persist. These include: 1) stock valuations that are higher than normal, 2) escalating geopolitical risks, especially in the Middle East, and 3) mounting uncertainty around the outcome and policy implications of the U.S. elections.

One of the biggest concerns surrounding the elections is the potentially negative impact of both candidates’ campaign promises on an already high level of U.S. national debt. Neither candidate has come across as fiscally responsible; their fiscal profligacy is instead projected to increase government spending by an additional $5-7 trillion over the next 10 years.

The national debt is a topic of great interest and worry to many people. We focus exclusively on fiscal policy risks in this article.

We recognize that this is a highly charged and potentially contentious topic. We refrain from any ideological, philosophical, political or moral judgment on the topic; our views are focused only on the likely economic and market impact of the U.S. debt burden.

We interchangeably refer to the national debt as total public debt from hereon and set out to answer the following questions.

  • How has the U.S. total public debt grown and who are its main holders?
  • How vulnerable are U.S. interest rates to demands for a higher risk premium i.e. greater compensation for bearing risk?
  • Has the higher debt level contributed to higher economic growth and national wealth?
  • How onerous is the current debt burden and what milestones would further exacerbate fiscal risks?

Sizing the U.S. Debt Burden

The most eye-catching depiction of rising government debt is the nearly six-fold increase in its dollar value over the last 25 years. Total public debt has risen from just under $6 trillion at the turn of the century to almost $35 trillion by June of 2024.

Most of this debt was issued to stabilize the U.S. economy from two devastating shocks during this time – the Global Financial Crisis (GFC) in 2008-09 and the global pandemic in 2020. Since stability of economic growth is a key goal of fiscal policy, the most commonly used metric for the U.S. debt burden is the ratio of total public debt to Gross Domestic Product (GDP). Figure 1 illustrates how total public debt as a percent of GDP has grown over time.

Figure 1: Total Public Debt as a Percent of GDP 

Source: Federal Reserve Board of St. Louis, June 2024

The debt-to-GDP ratio has doubled from almost 60% prior to the GFC in 2008 to around 120% in 2024.

It is interesting to note the different trajectories of the debt-to-GDP ratio after the last two crises.

a. GDP growth after the GFC was anemic as it got dwarfed by an extensive deleveraging cycle.

Slow GDP growth post-GFC caused the debt-to-GDP ratio to spike up rapidly from 60% to 100%.

b. Unlike the GFC which was triggered by unsustainable fundamental excesses, the Covid recession was caused by a global lockdown stemming from health safety considerations. Growth rebounded quickly when economies reopened and was further bolstered by government spending.

Faster post-pandemic GDP growth has contributed to a slower increase in the debt-to-GDP ratio from 100% to 120%.

Most people are alarmed and worried about this rapid increase in the national debt. At first glance, their concerns appear to be well-founded. High and rising government debt could reduce private investment, lead to higher inflation and interest rates, reduce economic growth, weaken the currency, limit future policy flexibility, and create inter-generational inequities.

We analyze these risks by looking at who owns this debt and why, what might make U.S. government debt attractive even at these levels, and whether this level of debt can produce any economic benefits.

Contrary to most prevailing opinions, we believe the fiscal outlook is not nearly as dire. We see no meaningful risk to growth, inflation, interest rates or the dollar in the foreseeable future of 3 to 5 years.

We begin by understanding the composition of the national debt.

Who Owns the U.S. Debt and Why?

Mix of U.S. Debt Holders

Figure 2 shows the two main categories of the gross national debt: debt held by the public (i.e. debt owed to others) and debt held by federal trust funds and other government accounts (i.e. debt owed to itself).

Figure 2: Composition of Gross National Debt

Source: U.S. Department of Treasury, December 2023

Of the $34 trillion in national debt at the end of 2023, $7 trillion, or 21%, was intragovernmental debt which simply records a transfer from one part of the government to another. Intragovernmental debt has no net effect on the government’s overall finances.

In Figure 3, we take a closer look at the remaining 79%, or almost $27 trillion, of the gross national debt which is held by the public. This portion is generally regarded as the most meaningful measure of debt since it represents Treasury borrowings from outside lenders through financial markets. Debt held by the public was 96% of GDP at the end of 2023.

Figure 3: Composition of Debt Held by the Public

Source: U.S. Department of Treasury, December 2023

Almost 70%, or $19 trillion, of the debt held by the public is in the hands of domestic institutions. The remaining 30%, or $8 trillion, is held by foreign entities, split almost equally between foreign private investors and foreign governments.

We examine the motivations of these entities for holding the national debt now and in the future.

Many Reasons to (Still) Hold U.S. Government Debt

Figure 3 shows that the single largest holder of the U.S. national debt is the Federal Reserve Board. When policy rates reached their zero lower bound in 2020, the Fed lowered long-term interest rates by buying bonds. As a result, the Fed still holds more than $5 trillion of U.S. government bonds. It is safe to assume that the Fed is a reliable lender to the Treasury and is unlikely to trigger a sharp increase in interest rates through its own actions.

Mutual funds own more than $3 trillion of U.S. government bonds to achieve diversification in investment portfolios. U.S. government bonds are among the few investments that can protect portfolios during downturns. The safety and long “duration” of U.S. Treasury bonds typically enable them to appreciate when stocks decline during a selloff.

Corporate and public pension funds typically have long-term liabilities to meet the pension obligations of their retirees. As a safe long-duration asset class, U.S. Treasury bonds are a core building block for pension funds to hedge their long-duration liabilities.

Japan and China are the two largest foreign holders of U.S. government debt. Low domestic interest rates in Japan make U.S. bonds particularly appealing for Japanese investors. China runs a large current account surplus, primarily from its favorable trade imbalance of exporting more than importing. China is a natural buyer of safe-haven assets for its more than $3 trillion of foreign exchange reserves.

Unlike the U.S. consumer, foreign consumers tend to save more. This results in a glut of global savings that is simultaneously seeking safety, quality, income, and liquidity. There is no other bond market in the world that offers the size and safety of the U.S. bond market. Figure 4 illustrates the relative size of the world’s largest bond markets.

Figure 4: The World’s Top Bond Markets

Source: BIS, Visual Capitalist, Q3 2022

The U.S. bond market is valued at more than $50 trillion and represents nearly 40% of the global bond market. China’s bond market carries risks of fundamental weakness, currency depreciation and capital controls. The Japanese bond market offers unattractively low interest rates. The remaining bond markets are so small that they do not offer a viable alternative to U.S. bonds.

Now, we take a quick look at the empirical evidence on risks associated with high debt and deficit levels.

High debt and deficits are intuitively associated with high inflation and interest rates. It seems reasonable that greater government spending could spur demand and trigger inflation; it could also curtail private investments from the “crowding out” effect of higher interest rates. Any subsequent tightening to tame inflation would then further slow growth down.

It turns out that this storyline has indeed played out a number of times in high-inflation developing economies. However, it may surprise many of our readers to learn that this is not the norm in low-inflation advanced economies 1. It certainly hasn’t been the case in the U.S. for several reasons.

The U.S. central bank is highly regarded and enjoys strong global credibility. The Fed successfully kept long-term inflation expectations anchored even as inflation reached 9% in 2022. The big increase in total public debt to GDP from 60% to 100% in the aftermath of the GFC didn’t stoke inflation in the ensuing economic recovery.

The U.S. also has solid governance mechanisms to guard against excessive fiscal dominance; two political parties and two independent chambers of Congress provide institutional checks and balances. The U.S. dollar enjoys significant advantages from its status as the world’s reserve currency. The U.S. is home to many of the most innovative and profitable companies in the world, is blessed with abundant natural resources, and boasts a strong military presence.

We are mindful that high levels of borrowing carry inherent risks and that they cannot keep growing endlessly without consequences. However, at this time, we are hard-pressed to pinpoint a specific threshold at which U.S. government debt would become undesirable or untenable.

From a strictly economic perspective, we believe the current level of U.S. national debt is not particularly problematic.

i. Excluding intragovernmental debt and debt held by the Fed, the U.S. debt-to-GDP ratio falls from 120% to 77%.

ii. The remaining domestic and foreign investors have strong incentives to hold U.S. bonds for safety, liquidity, diversification and hedging needs; in any case, there is no viable alternative to the U.S. bond market.

We conclude with a quick look at how the recent increase in total public debt has coincided with economic or market gains.

National Debt and National Wealth

In the four years from 2019 to 2023, total public debt rose from $23.2 trillion to $34 trillion, while nominal GDP grew from $21.9 trillion to $28.3 trillion. The post-Covid annual growth rate of 6.5% in nominal GDP was a lot higher than the meager 4% annual growth from 2009 to 2019.

A number of factors were different in these two periods. A long cycle of deleveraging restrained growth in the post-GFC recovery. An equally powerful theme in this recovery is the significant, but still nascent, impact of technology and AI on the economy and markets. Over the last few years, pandemic-related health safety needs have spurred numerous technological innovations and inventions.

There is a school of thought that our current GDP measurement may not fully capture all the benefits of technological advancements. We will explore this theme in a different setting at a different time. But for now, this notion prompts us to examine the association of debt levels with other measures of well-being or monetary gains.

In this setting, we identify the U.S. national wealth as a useful measure of prosperity. National wealth aggregates the total nominal value of assets and liabilities across all sectors of the U.S. economy. These assets include real estate, corporate businesses and durable goods; liabilities include foreign claims on U.S. assets.

Figure 5 shows the rapid rise in both national wealth and national debt.

Figure 5: Growth of National Wealth and National Debt

Source: Federal Reserve Board of St. Louis, June 2024

The two biggest components of national wealth, by far, are real estate and domestic businesses. We have long argued that one of the key factors behind the resilience of the U.S. consumer is the wealth effect. Home prices and stock prices are at all-time highs and, as a result, so is household net worth. The top quintile of households by income, who account for more than half of all consumer spending, have particularly benefited from the wealth effect.

Several factors have contributed to the rise in national wealth. It is difficult to ascertain exactly what role the fiscal stimulus may have played in its recent rapid growth. However, we do believe that fiscal policy has contributed in some positive manner to the growth in national wealth.

We look at national debt as a percent of national wealth in Figure 6.

Figure 6: Steady Debt to Wealth Ratio in Last 15 Years

Source: Federal Reserve Board of St. Louis, June 2024

The dollar value of both the national debt and national wealth has nearly tripled from 2009 onwards. As a result of the synchronized growth rate in both metrics, total national debt has held steady between 22-25% of national wealth from 2009.

To the extent that the pandemic simultaneously unleashed both significant fiscal stimulus and highly profitable technological innovation, national debt and wealth have moved in tandem. By this yardstick, the U.S. national debt burden looks less onerous.

Summary

We recognize how intensely people feel about the national debt burden. We also understand that there are several intuitive reasons to worry about it. We pass no judgment to either condone or condemn it in this article; we simply examine its likely economic and market impact in the coming years.

We summarize the many reasons why investors hold U.S. government debt and will likely continue to do so on similar terms.

  • High credibility of monetary policies
  • Unparalleled size, safety, quality and depth of the U.S. bond market
  • U.S. dollar as the world’s reserve currency
  • Lack of viable alternatives for domestic and foreign investors
  • Diversification and hedging needs of long duration asset owners
  • Solid governance against fiscal dominance
  • Global glut of savings
  • Disinflation from technology
  • Vibrant economy and formidable military 

We do not expect the national debt burden to create meaningfully higher inflation, higher interest rates or a weaker dollar in the foreseeable future of 3 to 5 years.

We remain vigilant and alert, but we maintain our conviction that the U.S. economy continues to head steadily towards a new equilibrium. We do not anticipate any imminent major shocks in this new economic cycle and bull market.

1Footnote: “Fiscal Deficits and Inflation”, Luis Catao and Marco Terrones, International Monetary Fund


To learn more about our views on the market or to speak with an advisor about our services, visit our Contact Page.

Excluding intragovernmental debt and debt held by the Fed, the U.S. debt-to-GDP ratio falls from 120% to 77%.


The remaining investors have strong incentives to hold U.S. debt for safety, liquidity, diversification and hedging needs.


We do not expect the national debt burden to create meaningfully higher inflation, higher interest rates or a weaker dollar in the foreseeable future of 3 to 5 years.

From Investments to Family Office to Trustee Services and more, we are your single-source solution.

An image of a silver and gold ring intertwined together.

Whittier Trust, the oldest multi-family office headquartered on the West Coast, is proud to announce that Robert L. Levy has been elevated to the role of Director of Investments for Whittier Trust Company of Nevada, Inc., as a reflection of his continued dedication and contributions to the firm. In this new role, Robert helps oversee the company’s investment strategy, leads a highly skilled investment team and spearheads the identification and execution of key investment opportunities while guiding client investment policy objectives.

David Dahl, President & CEO of Whittier Trust, commented on Robert’s remarkable career, stating, “Robert has been with Whittier Trust for more than two decades and has consistently demonstrated exceptional investment, acumen and leadership. His track record in identifying profitable opportunities has been instrumental in driving the growth of our investment strategies. We are confident that under Robert’s leadership, our clients will continue to benefit from our firm’s robust investment approaches.”

Robert’s tenure at Whittier Trust began in December 2000, and his contributions have been critical in helping the firm and its clients navigate many complex and unprecedented market cycles. He has played a key role in growing both client portfolios and the firm itself.

As Director of Investments, Robert has a pivotal role in shaping Whittier Trust’s investment philosophy, creating customized strategies for clients, and overseeing the firm’s flagship large-cap equity strategy, known as Corporate America. He will also continue to serve on Whittier Trust’s committee that analyzes, selects, monitors, and advises on external investment managers, ensuring that clients have access to top-tier advisors and exceptional investment guidance.

Robert is an active member of the Nevada community, where he serves on the boards of Whittier Trust Company of Nevada, Big Brothers Big Sisters of Northern Nevada and the Renown Health Foundation. His commitment to giving back is also reflected in his role as Trustee of the Joshua L. Anderson Memorial Foundation and College Scholarship Fund.


For more information about Whittier Trust's investment strategies and portfolio management services, start a conversation with a Whittier Trust advisor today by visiting our contact page.


From Investments to Family Office to Trustee Services and more, we are your single-source solution.

An image of a silver and gold ring intertwined together.
empty image