Shifting Gears In The Economic Cycle
The U.S. economy has now remained resilient to the massive post-pandemic inflation shock for well over two years. As a result, the economic outlook has changed dramatically from the inflation peak in June 2022. We trace this progression to assess where we stand now and what lies ahead.
The longest economic expansion on record from 2009 to 2020 established a new, lower trend-line real GDP growth rate of just below 2% for the U.S. economy. Against this benchmark, investor expectations have shifted sequentially through the following four phases of real GDP growth from 2022 onwards.
- Inevitable recession - Negative growth, well below 0%
- Soft landing - Below-trend growth, above 0% but below 2%
- No landing - Trend growth, around 2%
- “Launch” landing - Above-trend growth, above 2%
We describe the last scenario as a “launch” landing in our lexicon and believe the new post-pandemic economic cycle will normalize at real GDP growth above 2% in 2025 and beyond.
While this evolution of the economic outlook may have surprised many investors, it almost played out as we expected three years ago. We were firmly of the opinion that inflation would subside rapidly as pandemic-induced supply shortages resolved on their own. We believed the U.S. economy had become more insulated from interest rate increases as consumers and corporations locked in low, long-term, fixed rates for their loan obligations. We had all but ruled out a recession and believed that growth was likely to surprise to the upside.
The momentum of the economy in 2024 was strong enough to overcome the uncertainty of the U.S. elections. If anything, the unexpected GOP sweep in November raised hopes of an even stronger economy on the heels of continued fiscal stimulus and deregulation. Company profits in 2024 were almost in line with lofty forecasts and earnings growth expectations for both 2025 and 2026 are still high at 13-15%.
It is no surprise then that the U.S. stock market delivered strong performance yet again in 2024. The S&P 500 index rose by 25.0%; the Nasdaq index, which includes the Magnificent 7 group of technology leaders, gained 29.6%; and the Russell 2000 index of small companies was up 11.5%. In fact, the S&P 500 index has now delivered the rare outcome of back-to-back total returns of at least 25% in two consecutive years.
The continued strength in the U.S. economy and stock market brought a lot of cheer to investors in 2024. However, it has now led to two major concerns in 2025.
Investors got clear evidence in July 2024 that the Fed could soon start cutting interest rates when headline CPI inflation registered its first post-pandemic monthly decline. From that point on, investors aggressively priced in multiple rate cuts under the benign scenario of continued disinflation and solid Goldilocks growth which was neither too hot nor too cold.
These expectations began to unravel towards the end of 2024. As investors began to price in a Trump win and then eventually saw the GOP sweep, interest rates began to rise in anticipation of a number of knock-on effects related to the election outcome.
a. Higher economic growth from continued fiscal stimulus, a new regime of deregulation and technology-led growth in productivity
b. Higher fiscal risks from larger fiscal deficits
c. Higher inflationary pressures from both higher growth and new policies on tariffs and immigration
At the same time, prospects of higher economic growth and higher corporate profits pushed stock prices and valuations higher.
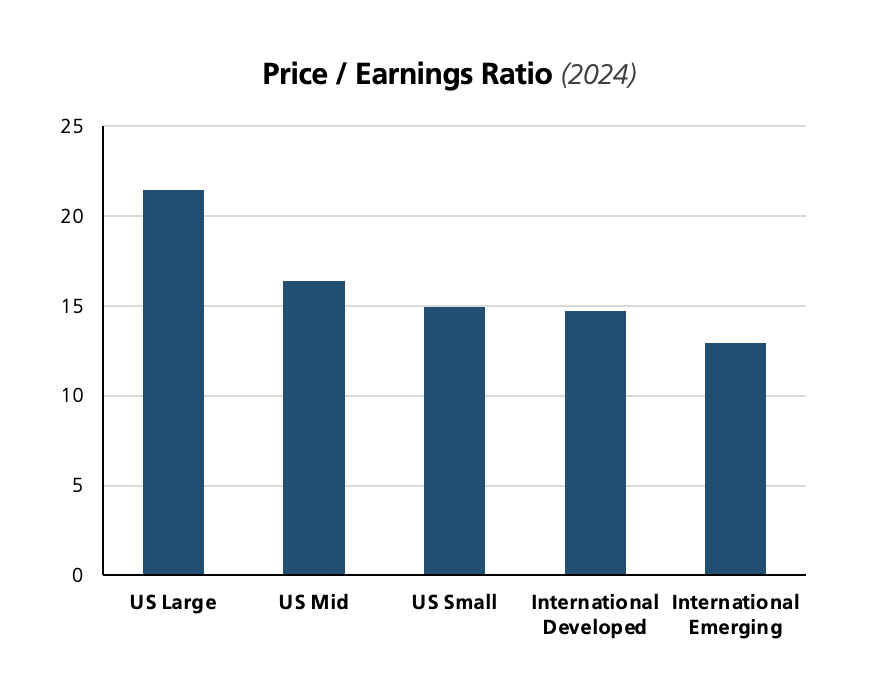
In the last four months (from mid-September to the time of writing), interest rates have risen by more than 1%. Market expectations of Fed rate cuts have now declined to less than two; in fact, many are now assigning a non-zero probability to rate hikes in 2025. And in the stock market, strong returns have pushed valuations higher; the forward P/E for the S&P 500 stood at 21.5 at the end of December 2024.
These data points now pose the following risks to investors.
- Will interest rates stay high or go even higher? Will high(er) interest rates bring down the stock market and eventually stall the economy?
- Even if the stock market survives the burden of high interest rates, will it buckle under the weight of its own (high) valuations?
We address these two key questions on the way to developing our 2025 economic and market outlook.
Interest Rates
The recent low in the 10-year Treasury bond yield was 3.6% on September 16, 2024. After a strong jobs report on January 10, 2025, the 10-year Treasury yield almost reached 4.8%. This 1.2% increase is significant because it is unusual for long-term rates to move higher after the onset of a Fed easing cycle.
We see this historical anomaly more clearly in Figure 1.
Figure 1: 10-Year Treasury Yield Before and After First Fed Cut
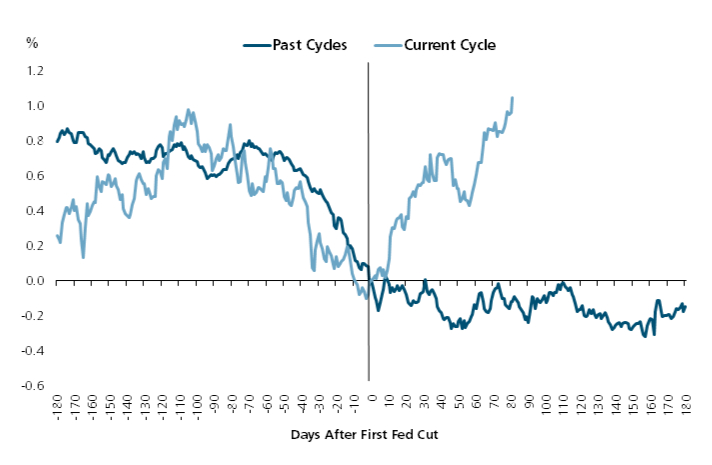
Source: FactSet; Average includes rate cuts from June 1989, September 1998, January 2001, September 2007 and July 2019; as of January 10, 2025
Long-term interest rates normally decline when the Fed starts cutting rates. The simultaneous decline in both short-term and long-term interest rates is intuitive. Fed rate hikes usually slow the economy down to the point where rate cuts become necessary to prop it up. Fed rate cuts normally coincide with economic weakness and, therefore, a decline in long-term rates.
The divergent trend in Figure 1 is another reminder about the inefficacy of monetary policy in this economic cycle. At the outset, post-pandemic inflation was more attributable to supply side disruptions and fiscal stimulus than it was to monetary stimulus. Then, Fed rate hikes and higher interest rates didn’t cause the type of demand destruction that one would have normally expected. And now, expectations of higher growth are being driven by factors other than monetary policy.
We make an argument in the following sections that we are shifting to a higher gear of growth in this economic cycle. We observe in passing that the drivers of economic growth are also shifting. We believe the baton for higher future growth has now been handed off from monetary policy to higher productivity growth, deregulation and fiscal stimulus.
The first stage of our interest rates analysis is to understand why they are going up.
Nominal interest rates are comprised of two components: 1) inflation expectations and 2) real interest rates. We look at each of these factors separately.
Inflation Expectations
Under normal conditions, the 10-year Treasury yield will generally exceed inflation expectations for the next 10 years. Longer term policies drive these inflation expectations more than shorter term trends. In the current setting, inflation fears have been elevated by prospects of higher growth, immigration policies that may reduce the supply of workers and the implementation of proposed tariffs.
We do not believe that 10-year inflation expectations have changed materially in the last few months. For a while now, we have thought the Fed’s 2% inflation target was likely to be elusive. Our fair estimate of 10-year inflation expectations is slightly higher at around 2.25%.
We believe the market is mispricing a higher level of expected long-term inflation. We support our more benign view on inflation with the following observations.
i. We know high universal tariffs can be inflationary and harmful to domestic growth. We don’t believe they will be implemented as originally proposed; they will ultimately be selective, targeted and reciprocal. We believe the threat of tariffs is likely a negotiating tactic; it is aimed more at opening up foreign markets than at sourcing revenue. The bark of expected tariffs will probably end up being a lot worse than its actual bite.
We believe that the impact of immigration policy on the economy will also be less severe than anticipated.
ii. Inflation has been trending higher in recent months. We believe there may be some unusual base effects at play in these short-term trends. CPI prices fell in the fourth quarter of 2023, then rose sharply in the first quarter of 2024 and have been fairly steady thereafter. As a result, year-over-year changes in CPI inflation may come down in the coming months.
In any case, these recent trends are unlikely to materially affect inflation over the next 10 years. Counter to growing investor concerns, expectations for 5-year inflation, starting in 5 years from now, have remained well-anchored at about 2.3% even as long rates have gyrated violently.
iii. And finally, we maintain our high conviction that technology will continue to create secular disinflation in the coming years. We are hard pressed to think of enough inflationary tailwinds to overcome this one powerful disinflationary force.
We next look at the other potential drivers of the increase in long-term interest rates.
Real Interest Rates
Real interest rates are primarily influenced by long-term changes in the level of economic activity. Increases in economic growth rates cause the real interest rate (and, therefore, the nominal rate as well) to increase and vice versa. In fact, one of the more useful heuristics in the capital markets is that long-term nominal interest rates are typically bounded by the long-term nominal GDP growth rate expectations.
For the sake of completeness in our analysis, we make a small detour here to resolve one other nuanced driver of changes in real interest rates — changes in the risk premium. If investors perceive fiscal risks to be higher, they will in turn demand a greater compensation for bearing that risk through higher interest rates.
There is a great deal of angst that the incoming administration will continue to increase government spending and the fiscal deficit. We tackled this concern about greater fiscal risks comprehensively in our 2024 Fourth Quarter Market Insights publication.
For a myriad of reasons, we concluded that fiscal risks are not as elevated as feared and unlikely to trigger higher inflation or higher interest rates. We believe that any pricing of a higher risk premium into higher nominal yields today is unwarranted.
We resume our focus on the topic of economic growth.
In a material shift in our thinking, we now see the U.S. economy shifting to a higher growth gear in the next decade. In the pre-Covid economic cycle, real GDP growth in the U.S. averaged an anemic sub-2%. We expect real GDP growth will now exceed 2.5% over the next 2-3 years and conservatively average 2.25% over the next decade.
These forecasts imply an upward shift of at least 0.5% in real GDP growth from the prior cycle. At first glance, this may seem overly optimistic because of the obvious headwind of an ageing population.
We know the natural or potential growth rate of an economy has two basic components: 1) growth in the labor force and 2) productivity gains of existing workers. We concede that unfavorable demographics and potentially adverse immigration policies will likely reduce the size of the future labor force.
This places the onus for higher GDP growth squarely on the second factor of increased productivity. In fact, with flat to negative growth in the labor force, productivity will need to increase by 0.5-1.0% to boost GDP growth rates by 0.5% or more. How feasible is this outcome and why?
We make the following arguments numerically and fundamentally to support the feasibility of such an outcome. We begin with a look at trends in productivity growth going back about 75 years in Figure 2.
Figure 2: Productivity Changes in the Non-Farm Business Sector
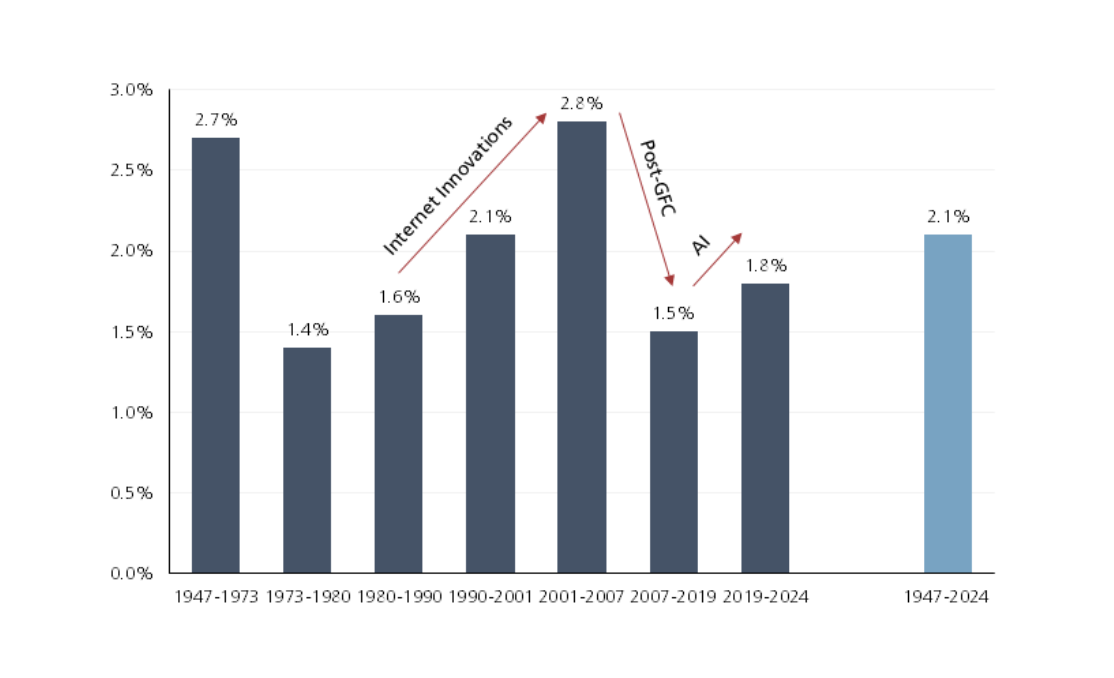
Source: U.S. Bureau of Labor Statistics; as of December 2024
The light blue bar in Figure 2 shows the average annual productivity growth rate in the last 75 years is 2.1%. However, productivity growth does fluctuate a lot around this long-term average. As a rule of thumb, it declines during recessions and periods of slow growth (1970s and the Global Financial Crisis – GFC) and rises during periods of growth and innovation (1980s and 1990s).
We can also see that big swings in productivity growth rates of +/-1% are feasible. Productivity growth rose by more than 1% during the era of Internet Innovations and fell by more than 1% post-GFC.
We believe the new post-Covid economic cycle will foster both innovation and growth for a number of reasons. Technology was deployed at a rapid pace during the pandemic with a positive impact on business operations e.g. hybrid work arrangements, automation and robotics.
Recent advances in AI have also set the stage for significant productivity gains in the coming years. Investments in AI so far have focused on the “infrastructure” phase to facilitate training, learning and inference. We are now moving into the “application” phase where AI systems and agents will monetize this infrastructure to create practical solutions and economic value across the enterprise.
Finally, stimulative deregulation policies from the new administration will also streamline business processes and unlock operational efficiencies. The trifecta of technology, AI and deregulation can easily unlock an increase in productivity growth of approximately 1%.
Our forecast for the real interest rate over the next 10 years is 2.25%, in line with our real GDP growth estimate.
We now have forecasts for both inflation expectations and the real interest rate. Coincidentally, they are both around 2.25%. Our fair estimate for the 10-year Treasury yield is simply the sum of these two components.
We expect the 10-year Treasury yield will settle in the 4.5-4.6% range by the end of 2025. We don’t expect it to go much higher than the 4.8% level of January 10; it will instead recede by a small margin.
We are clear that an increase in real rates is a bigger factor in driving interest rates higher than a change in inflation expectations. We do not believe that inflation is headed higher; it will instead move lower in a bumpy manner. Based on our inflation outlook, the Fed will have more room to cut rates in 2025.
Higher real rates signal a stronger, healthier economy. Stronger economic growth bodes well for corporate profits. We believe that our inflation forecast of 2.25% and 10-year Treasury yield forecast of 4.5% will still be supportive of stock prices.
We close out our analysis and outlook for 2025 with a look at stock market fundamentals.
Stock Market Valuations
U.S. stocks have performed well in the last two years. While their returns have been naturally rewarding, those same high returns have also created risks going into 2025.
On the heels of two consecutive years of at least 25% total returns, U.S. stocks now appear expensive. Many valuation metrics are in the highest quintile of their historical ranges. We take a closer look at a couple of these valuation measures.
At the outset, we acknowledge the topic is complicated and nuanced. Our research is always deep, thorough and rigorous. However, our insights here are curtailed by the finite scope of this article.
We are mindful that the four most dangerous words in investing are widely believed to be “this time is different.” And yet, we also know that a number of time-tested paradigms haven’t worked in the post-pandemic economy and markets. The absence of a recession so far on the heels of an inverted yield curve even after a long lag of two years is a case in point.
We do our best to straddle this balance between respecting historical norms and yet thinking creatively and fundamentally about what might indeed be different this time around.
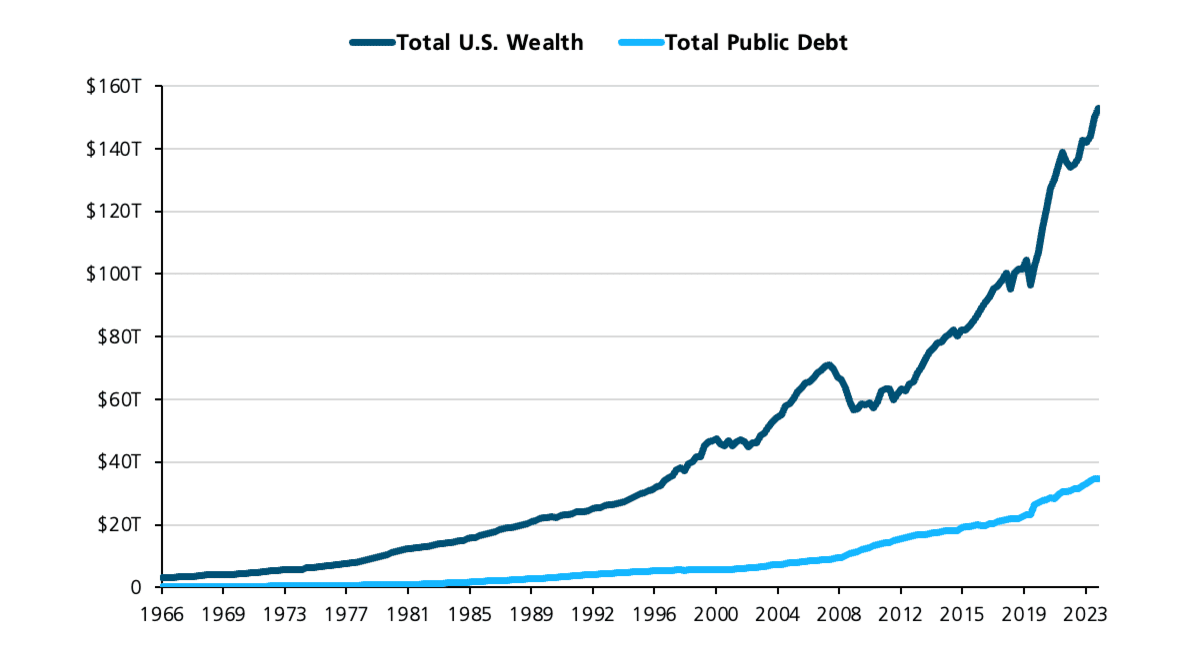
A commonly used valuation indicator was originally identified by Warren Buffett in a 2001 Fortune magazine essay. The Buffett Indicator measures the market value of all publicly traded U.S. stocks as a percentage of U.S. GDP. When the metric is high, stocks are vulnerable to a sell-off.
The Buffett Indicator has attracted significant attention in recent weeks as it went surging past a level of 200%. In other words, the market capitalization of all U.S. stocks is now more than double the level of total U.S. GDP. The Buffett Indicator suggests that U.S. stocks are now significantly over-valued.
We respect the broad message here that U.S. stocks are not cheap. However, we believe that a couple of relevant insights provide a more balanced perspective on this valuation metric.
The Buffett Indicator is anchored only to U.S. GDP in its denominator. However, many U.S. companies compete effectively in foreign markets. Since a growing number of U.S. companies are multi-national, a material and increasing portion of S&P 500 earnings is generated overseas. Clearly, the market value of all U.S. stocks in the numerator is not bounded by just the size of the U.S. economy. This mismatch causes the Buffett Indicator to rise steadily over time.
We look at another fundamental difference over time that may more rationally explain the trend in the Buffett Indicator.
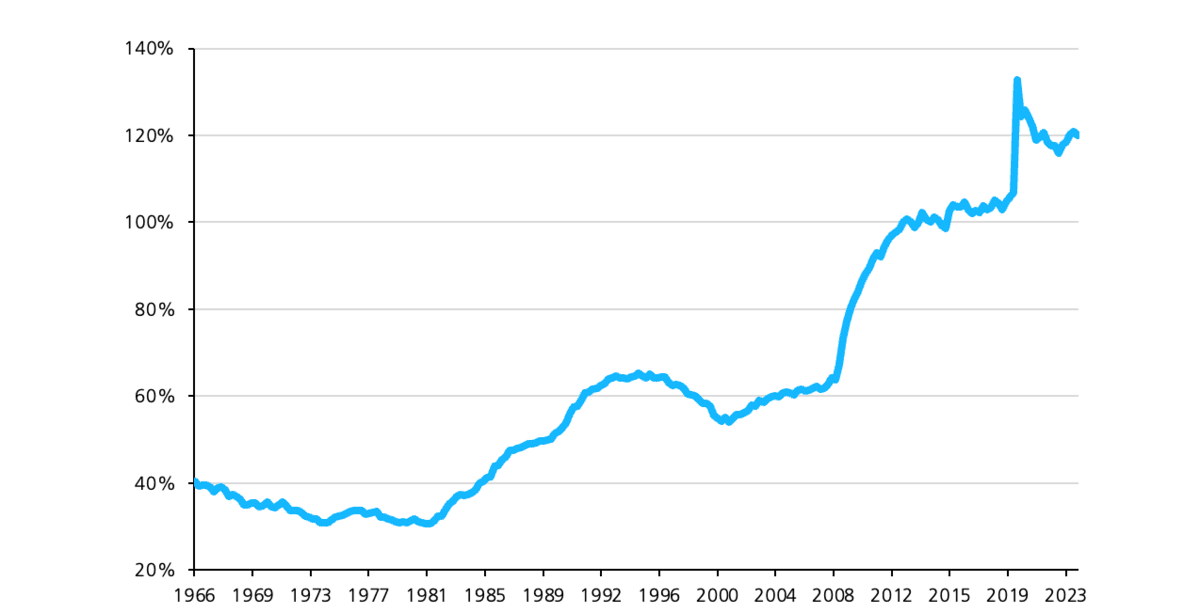
We know stock prices follow corporate profits; as go profits, so do stock prices. Much like the construct of the Buffett Indicator, we track U.S. corporate profits as a percentage of GDP in Figure 3.
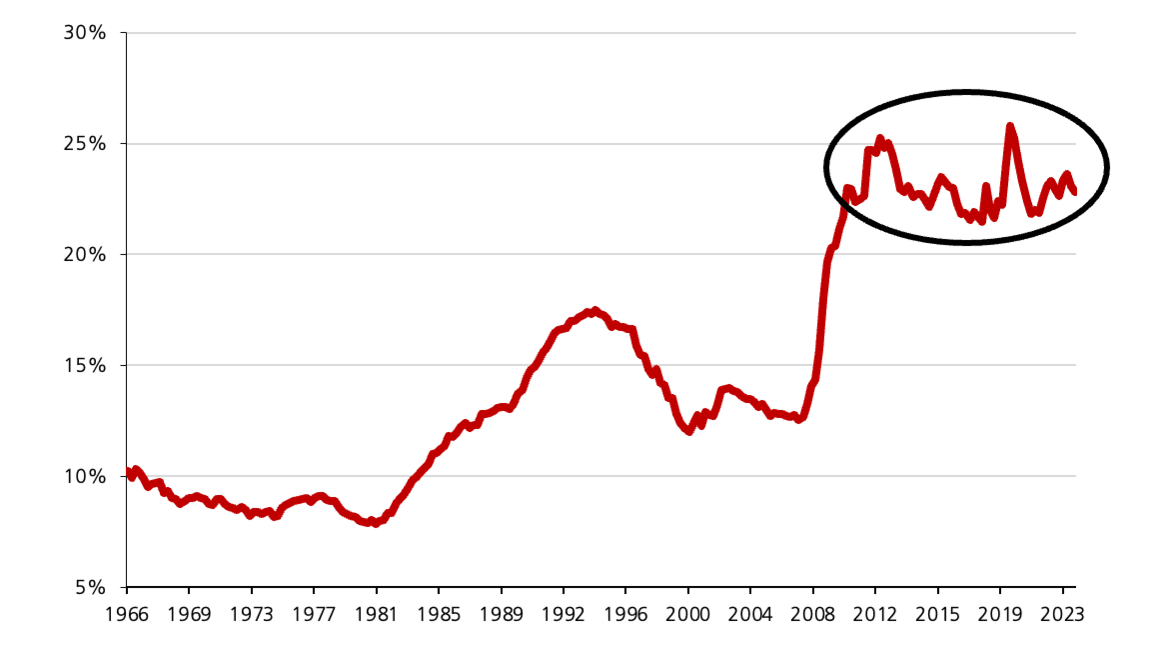
Figure 3: U.S. Corporate Profits as a Percent of GDP
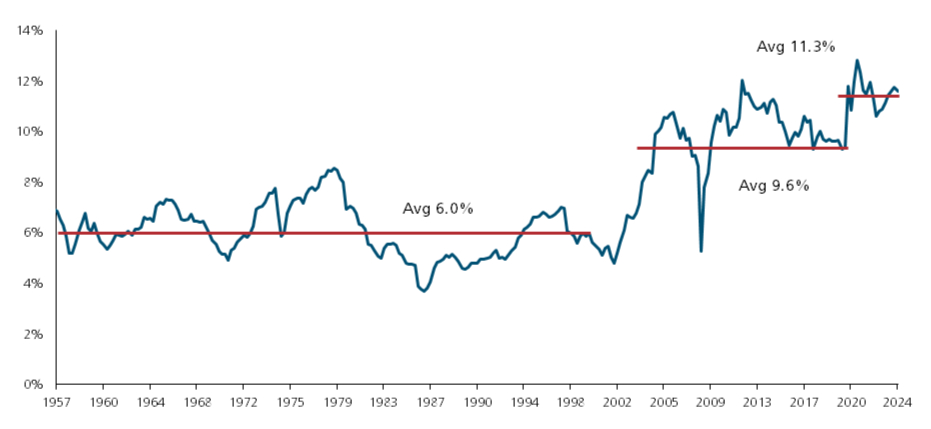
Source: U.S. Bureau of Economic Analysis; as of Q3 2024
U.S. companies have continued to become more and more profitable. Almost analogous to the doubling of the market value of all U.S. stocks as a percent of GDP, U.S. corporate profits as a percent of GDP have also nearly doubled from 6.0% to 11.3%.
We believe these fundamental connections between the growth of U.S. corporate profits and the rise in U.S. stock values help us better understand and interpret the Buffett Indicator.
In a similar vein, the Forward P/E (“FPE”) multiple has attracted a lot of attention in recent months. At 21.5 as of December 2024, it is also in the highest quintile of its historical range.
There are two concerns related to the FPE ratio. One, it relies on future earnings (“E”) that were already deemed lofty before the rise in interest rates. And two, even if E comes through as expected, the FPE ratio itself is at risk of compressing through a decline in prices (“P”). We address each of these risks separately.
We have already made our case for a higher gear of growth in the preceding sections. The sustainable spurt higher in real GDP growth from a revival of productivity growth should also spill over into earnings growth.
Consensus analyst forecasts call for an earnings growth rate of 14.8% in 2025 and 13.5% in 2026. We believe these growth rates can be achieved; there is still room for profit margins to expand and augment higher economic, productivity and revenue growth.
We are in general agreement with the market that the P/E ratio will decline in the coming months. We also know that higher starting valuations lead to lower future returns. We are clear that stock returns going forward will be more muted than those seen in recent years.
However, we disagree with the market on both the likely magnitude and speed of decline in the P/E ratio. Investors worry that the 2024 FPE multiple of 21.5 could slide all the way down to its long-term average of around 16. They also fear that the resulting bear market could unfold quickly over just a few months.
We believe that the compression of the FPE multiple will be neither so drastic nor so abrupt. U.S. companies are now more profitable than they have ever been; aggregate free cash flow margins exceed 10% and return on equity is almost 20%.
On the heels of secular innovation, growth and profitability, we believe the fair value of the S&P 500 FPE multiple is now higher at 18-19. We also believe that any decline in the FPE from 21.5 to 18-19 will be more gradual. We expect positive earnings growth to offset the more orderly compression of the FPE multiple.
We illustrate the difference in our stock market forecast and the market consensus in Figure 4.
Figure 4: S&P 500 Forward P/E Ratios and Subsequent 10-Year Returns
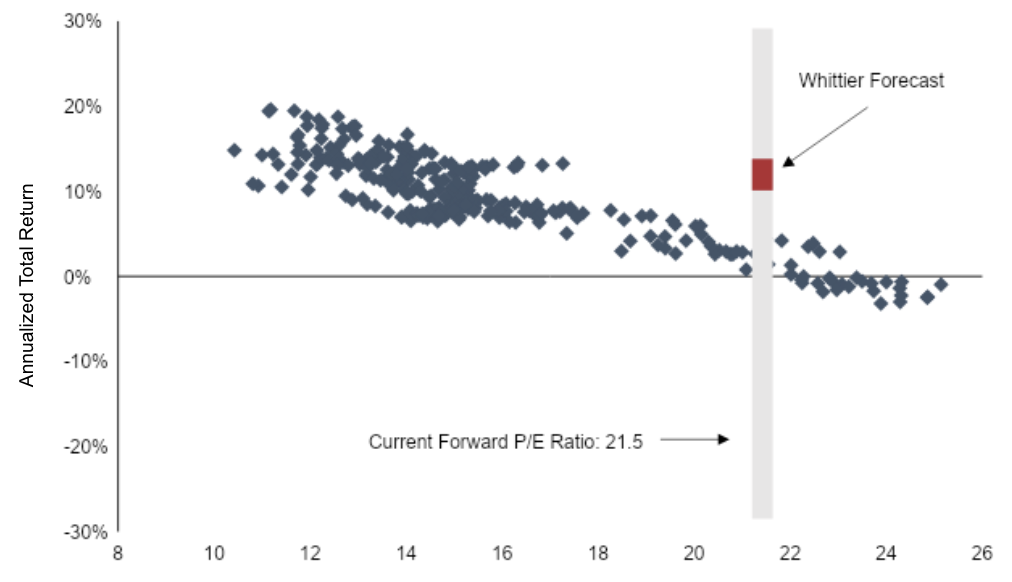
Source: Bloomberg; from 1988 onwards; as of December 2024
Figure 4 shows the historical association between the FPE ratio and subsequent 10-year returns from 1988 onwards. A quick visual inspection validates our intuition. Higher initial valuations do lead to lower future returns.
The historical data is heavily influenced by two mega crises that took place just a few years apart – the Bursting of the Internet Bubble (BIB) in 2000-2002 and the GFC in 2007 2009. In each instance, earnings declined significantly as did stock prices and valuations.
The empirical relationship in Figure 4 suggests that the current FPE ratio of 21.5 (shown by the grey vertical bar) may lead to stock returns as meager as 2-3% annualized over the next 10 years. A key assumption in this projection is that both earnings (E) and valuations (FPE) will fall as dramatically as they did in the BIB and the GFC.
Our fundamental analysis does not reveal significant downside in E or the FPE multiple. Our earnings outlook identifies more positive fundamentals (e.g. growth in profit margins and productivity) than negative ones (e.g. excessive leverage). We also believe that the fair value of the S&P 500 FPE ratio is now fundamentally higher than it was in prior decades.
We, therefore, expect a higher stock market return over the next 10 years in the range of 8-10% shown by the red bar in Figure 4. We believe that earnings growth of 8-10% and a dividend yield of 1-2% will offset valuation declines of 1-2% annually in the coming decade.
Our stock market outlook for 2025 is also optimistic. We believe expected earnings growth and the dividend yield will create a tailwind of almost 15%. Since interest rates have moved sharply in recent months, we realize the valuation compression in the near term may be as large as -5%. We aggregate these drivers to forecast a 10% total return for the S&P 500. We expect the S&P 500 to reach a level of 6,400 by the end of 2025.
We conclude with a summary of our outlook for the economy, inflation, interest rates and the stock market.
Summary
Economy
- We expect real GDP growth of 2.5% or above in the next 2-3 years in a significantly pro-growth regime.
- Real GDP growth will normalize at a level of around 2.25% over the next 10 years.
- We see a clear shift in the drivers and gears of economic growth. The impetus for higher growth in this cycle will come from deregulation, fiscal stimulus and an increase in productivity growth of 0.5-1.0%.
Inflation
- We do not see an inflection in inflation up to higher levels.
- Inflation should subside in a bumpy path to the 2.3-2.4% level by the end of 2025.
- We believe the fair value for inflation expectations over the next 10 years is 2.25%.
- We believe the market is mispricing a higher level of future inflation.
- The impact of tariffs and immigration will be more muted.
- Meaningful base effects will pull inflation lower in the second half of 2025.
- Technology will continue to be a powerful secular disinflationary force.
Interest Rates
- We estimate the real interest rate to be around 2.25% over the next 10 years.
- We believe the fair value for the 10-year Treasury yield is 4.5-4.6%.
- The bond market is overestimating the risk premium related to a perceived increase in fiscal risks.
- Interest rates are likely to come down from their 4.8% level.
- Based on our inflation outlook, the Fed will have more room to cut rates. We expect 3-4 rate cuts by the Fed in 2025.
- A Fed policy misstep in the form of rate hikes or bond yields above 5% as a result of overzealous bond vigilantes could trigger a financial accident and curtail growth.
Stock Market
- We believe that earnings growth and valuation fears in the stock market are overblown.
- As a result, our expected returns for stocks are higher than consensus over both the 1-year and 10-year horizons.
- We expect valuations to come down but not as dramatically or quickly as investors fear.
- We believe earnings growth will match or exceed expectations in the near term.
- We expect the S&P 500 to reach 6,400 by the end of 2025 and generate a 10% total return.
- Earnings growth and dividend yield will create a nearly 15% tailwind for stocks in 2025.
- Multiple compression of around -5% will detract from stock returns in 2025.
- We expect U.S. stocks will generate annual returns of 8-10% over the next 10 years.
- We reject the view that a severe valuation overhang will limit annual U.S. stock returns to 2-3% over the next 10 years.
We respect the difficulty of forecasting during normal times, and especially so in the midst of uncertainty. We will assimilate these views into our investment decisions with appropriate caution and adequate risk control.
We believe that 2025 will finally see a normalization of the U.S. economy after the recent pandemic and inflation shocks. We look forward to the prospects of investing in more normal markets.
To learn more about our views on the market or to speak with an advisor about our services, visit our Contact Page.
We expect real GDP growth of 2.5% or above in the next 2-3 years in a significantly pro-growth regime.
We believe the fair value for inflation expectations over the next 10 years is 2.25%.
We believe the fair value for the 10-year Treasury yield is 4.5-4.6%.
We expect U.S. stocks will generate annual returns of 8-10% over the next 10 years.
From Investments to Family Office to Trustee Services and more, we are your single-source solution.


 Whittier Trust, the oldest multi-family office headquartered on the West Coast, is pleased to announce the promotion of Brittany Renna, CFP®, APMA®, CTFA®, to the role of Vice President, Client Advisor, with the firm’s Newport Beach office.